Expected Limits on the Potential for Carbon Dioxide Removal From Artificial Upwelling
 David A. Koweek*
- Ocean Visions, Leesburg, VA, United States
Artificial upwelling, the engineered upward pumping of deep ocean water, has long been proposed as a technique to fertilize the ocean and, more recently, remove atmospheric carbon dioxide. This study investigated the potential of artificial upwelling to contribute to carbon dioxide removal using a simple model with high-resolution (1° × 1°) gridded monthly climatologies of upper ocean and deep ocean physical and chemical properties. The potential for carbon dioxide removal was explored across a range of observationally-informed carbon-to-nitrogen-to-phosphorus ratios for microalgae and macroalgae communities, providing information on the sensitivity of the estimates to any assumed carbon-to-nutrient ratios. Simulated carbon dioxide removal across the tropical-to-subpolar ocean did not exceed 0.66 tons per square kilometer per year for microalgae, and did not exceed 0.85 tons per square kilometer per year for macroalgae. Using current technology, the estimated global aggregate potential for carbon dioxide removal using microalgae was less than 50 megatons (0.05 gigatons) of carbon dioxide annually and the estimated global aggregate potential for carbon dioxide removal using macroalgae was approximately 100 megatons (0.1 gigatons) of carbon dioxide annually. While controlled field trials are needed to validate or invalidate the findings of this study, this study suggests that artificial upwelling is unlikely to support annual carbon dioxide removal at, or close to, the rate of one gigaton of carbon dioxide annually.
Introduction
Between 100 and 1000 gigatons of carbon dioxide removal from the atmosphere are now required to stabilize planetary warming at 1.5°C above pre-industrial temperatures (IPCC, 2018). In the recently released Working Group 1 contribution to the Intergovernmental Panel on Climate Change’s (IPCC) Sixth Assessment Report, all shared socioeconomic pathways corresponding to less than 2°C of warming above the pre-industrial also require gigaton-scale deployments of carbon dioxide removal (IPCC, 2021). To meet the urgent and growing demand for carbon dioxide removal, attention has been paid to terrestrial options (e.g., afforestration, soil carbon sequestration) and technological options (e.g., direct air capture, bioenergy with carbon capture and storage) (IPCC, 2018; National Academies, 2019). Although the ocean is the largest reservoir of carbon on the planet and currently absorbs approximately 31% of all anthropogenic carbon dioxide emissions (Gruber et al., 2019), ocean-based carbon dioxide removal pathways have received far less attention to date. Recent efforts have sought to address this knowledge deficit by accelerating the research and evaluation of ocean-based carbon dioxide removal pathways (Gattuso et al., 2018; GESAMP, 2019; Energy Futures Initiative, 2020; Gattuso et al., 2021; OceanNETs, 2021; Ocean Visions, 2021; National Academies, 2022).
Ocean-based pathways can broadly be categorized into abiotic or biotic pathways. Abiotic pathways use chemical processes to enhance the seawater alkalinity (ocean alkalinity enhancement) or remove carbon dioxide from seawater (direct ocean capture). Biotic pathways use photosynthesis to fix dissolved inorganic carbon into plant biomass (primary production), creating a deficit in the surface ocean aqueous carbon dioxide concentration that can be replenished through invasion of carbon dioxide from the atmosphere (GESAMP, 2019; Energy Futures Initiative, 2020). However, much of the world’s surface ocean is nutrient-limited, so additional nutrients are needed to support primary production in the ocean (Sarmiento and Gruber, 2006). Artificial upwelling (the engineered upward pumping of deep ocean water, typically through a pipe) of nutrient-replete deep ocean water could be one means to inject the additional nutrients into the surface ocean where they can support primary production (Stommel et al., 1956; Vershinskiy et al., 1987; Kirke, 2003; Oschlies et al., 2010; Pan et al., 2016).
While artificial upwelling may be an important tool in enhancing surface ocean primary productivity, its potential role in carbon dioxide removal from the atmosphere is far less apparent. In addition to abundant nutrient concentrations, the deep ocean is replete in dissolved inorganic carbon and total alkalinity. Artificial upwelling of deep ocean water to the surface will translocate large quantities of dissolved inorganic carbon and total alkalinity as well as nutrients. Thus the carbon dioxide removal potential of artificial upwelling is a balance between the enhanced primary productivity supported by the upwelled nutrients and the additional deep ocean dissolved carbon dioxide that may be liberated through artificial upwelling to return to the atmosphere. If the newly-produced organic matter has a higher carbon-to-nutrient ratio than the upwelled water and can be rapidly exported out of the mixed layer, beyond the depth of upwelling, and into the deep ocean for long-term sequestration, the potential for carbon dioxide removal exists. Otherwise, artificial upwelling may result in a net flux of carbon dioxide from the deep ocean to the atmosphere.
Past studies of artificial upwelling using Earth system models have projected a wide range of carbon dioxide removal potential from less than 0 gigatons of carbon dioxide per year up to 13 gigatons of carbon dioxide per year (Dutreuil et al., 2009; Yool et al., 2009; Oschlies et al., 2010; Keller et al., 2014). This range in projected carbon dioxide removal is enormous: on one end, it would worsen the buildup of atmospheric carbon dioxide, and on the other end, would provide the multi gigaton-scale annual carbon dioxide removal necessary to stabilize planetary warming. The recently released consensus report of the U.S. National Academies of Science, Engineering, and Medicine (2022) suggests a smaller range of carbon dioxide removal potential of between 0.1 and 1 gigaton of carbon dioxide per year, but this range still spans an order of magnitude. More information is needed to narrow this range of possibilities and evaluate the efficacy of artificial upwelling to contribute to removal of atmospheric carbon dioxide.
This study combines a simple model with high-resolution (1° × 1°) gridded monthly climatologies of upper ocean and deep ocean physical and chemical properties to quantify the potential of artificial upwelling to support carbon dioxide removal by lowering the surface ocean aqueous carbon dioxide concentration. In this model, biogeochemical changes in upwelled water are simulated using a range of carbon-to-nitrogen-to-phosphorus ratios determined from observational studies of microalgae and macroalgae communities. This study examines carbon dioxide removal potential of artificial upwelling in two ways: the near-term technological potential based on feasible depth limits of the artificial upwelling pump, and the geophysical potential of artificial upwelling if the depth constraints on pump length did not exist. This study highlights areas of the global tropical-to-subpolar ocean where artificial upwelling may contribute to carbon dioxide removal and quantifies the potential for carbon dioxide removal if upwelling pipes were to be uniformly deployed across the tropical-to-subpolar ocean as a dense network of pipes.
Methods
Theory
Air-sea exchange of carbon dioxide, J, is often expressed as:
Where k is the gas transfer velocity, K0 is the Henry’s law solubility constant, pCO2atm is the partial pressure of carbon dioxide in the atmosphere, and pCO2sw is the partial pressure of carbon dioxide in seawater (Wanninkhof et al., 2009).
Ocean-based carbon dioxide removal technologies lower the partial pressure of carbon dioxide in seawater to allow additional air-to-sea flux of atmospheric carbon dioxide beyond what would have occurred naturally. The additional air-to-sea flux from carbon dioxide removal, CDR, can be expressed as:
where the J' represents the air-sea gas flux due to a perturbed partial pressure of carbon dioxide in seawater, pCO′2sw, and K0′ is the corresponding Henry’s law solubility constant in the perturbed condition. Note that for ocean-based carbon dioxide removal technologies that do not change the surface water temperature nor the salinity, K0′ = K0. The above equation simplifies to:
Assuming a constant gas transfer velocity k, which is typically represented as an empirical function of wind speed over the open ocean (Wanninkhof et al., 2009), carbon dioxide removal is proportional to the partial pressure gradient between the background partial pressure of carbon dioxide in seawater and the perturbed partial pressure of carbon dioxide in seawater times the Henry’s law solubility constant.
This can also be expressed as a concentration gradient.
Introducing the Model
This study models carbon dioxide removal potential from artificial upwelling as the capacity of artificial upwelling to create a surface ocean aqueous carbon dioxide concentration ([CO2]) gradient at longitude x and latitude y pumping from a depth z during month t as:
where flight is the fraction of the day in the photoperiod, npipes is the areal density of upwelling pipes, ρ is the density of upwelled water, is the volumetric upwelling rate, [CO2]ML is the background aqueous carbon dioxide concentration in the mixed layer, and [CO2]′ is the predicted aqueous carbon dioxide concentration of upwelled water after biogeochemical modification. All model variables are explained in further detail below.
This model does not directly simulate the additional air-to-sea flux of carbon dioxide necessary for the ocean to uptake additional atmospheric carbon dioxide. Nor does it simulate the fate of newly produced organic matter and its impacts on surface ocean aqueous carbon dioxide concentration via export out of the surface layer, remineralization, ingestion, conversion to dissolved organic matter, or any other pathway. The implications of these simplifications are considered in the Discussion.
Model Variable Descriptions
The Fraction of The Day in the Photoperiod, flight
The fraction of the day in the photoperiod, flight, dictates the potential for photosynthesis to convert high nutrient, high carbon dioxide upwelled deep ocean water to low nutrient, low carbon dioxide at the surface. When flight equals 0, there is no photoperiod to sustain new biological production from artificial upwelling. When flight equals 1, the photoperiod is 24 hours-long. The photoperiod at latitude y during month t was calculated following Forsythe et al. (1995).
Pipe Characteristics: Maximum Depth, Volumetric Flow Rate (), and Areal Density (npipes)
There exists a gap in maximum upwelling pipe depth and volumetric flow rates between experimental field trials and modeling studies with the modeling studies allowing for deeper pipes with higher flow rates (Liu and Jin, 1995; Yool et al., 2009; Oschlies et al., 2010; Keller et al., 2014) than have been produced in experimental field trials (Vershinskiy et al., 1987; Liu, 1999; Kithil, 2007; White et al., 2010; Pan et al., 2019) (Figure 1). To more closely understand how near-term engineering constraints may or may not limit carbon dioxide removal potential, I considered two scenarios: one scenario where pipe depth is limited to 500 meters (slightly deeper than the maximum depths tested during field trials) and another scenario where there are no limits to pipe depth. This second scenario simulates a medium-term future scenario where pipe technology is more advanced than the present. Volumetric flow rate, , was held to 0.05 m3 s-1 in this study to reflect a feasible flow rate based on historical performance of upwelling pipes in field trials. The areal density of upwelling pipes, npipes, was held fixed at one upwelling pipe per square kilometer. This upwelling pipe areal density was chosen for consistency with past modeling studies (Oschlies et al., 2010) and represents an optimistic scenario for near-term deployment given the lack of field testing of any distributed pipe networks to date.
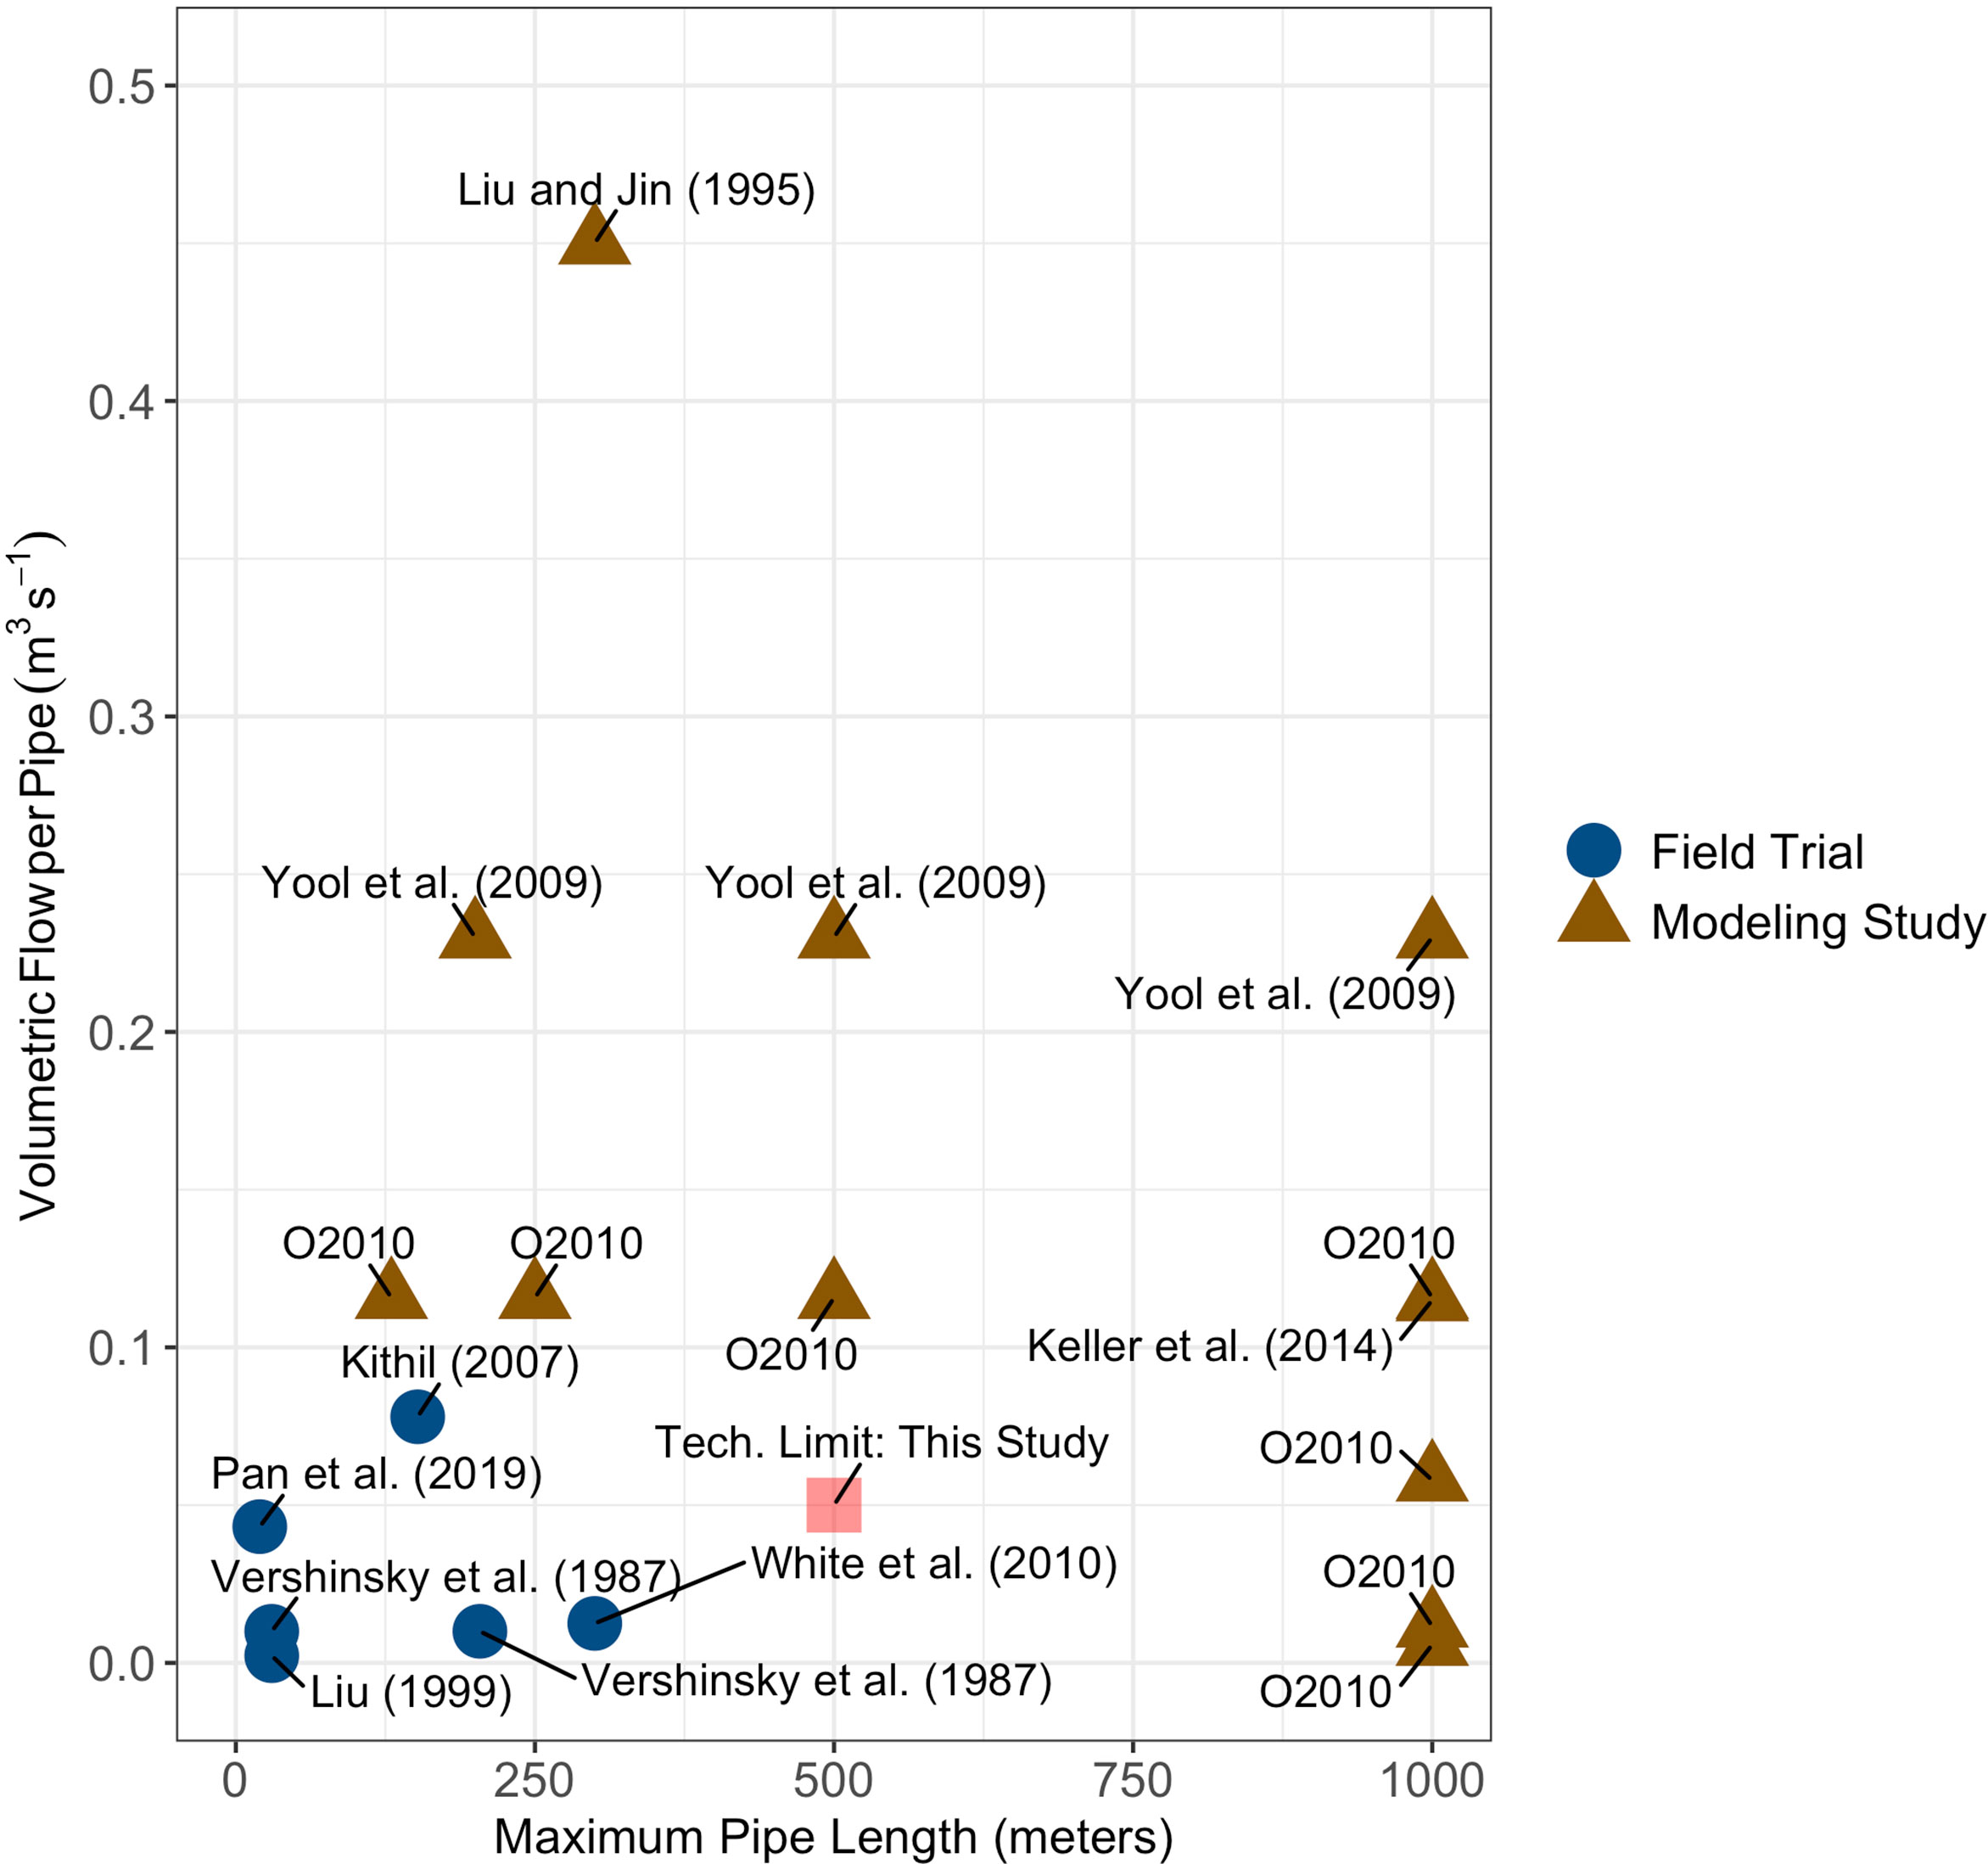
Figure 1 Upwelling pipe volumetric flow rates and maximum depths for field tests (blue circles) and modeling studies (brown triangles). The label ‘O2010’ refers to Oschlies et al. (2010). Volumetric flow rates for Yool et al. (2009); Keller et al. (2014), and Oschlies et al. (2010) were calculated from the reported upwelling velocities in each study and assuming an areal density of pipes of one pipe per square kilometer as discussed in Oschlies et al. (2010). The maximum depth and flow rate for the scenario where the depth of the upwelling pipe is limited to 500 meters is shown as a red square.
Density of Upwelled Water, p
Deep ocean water density (in units of kg m-3) was calculated from the salinity and potential temperature (θ; referenced to surface pressure) of the depth layer in the GLODAP version 2 data product (Lauvset et al., 2016).
Observed Mixed Layer Carbon Dioxide Concentration: [CO2]ML
The spatially and temporally varying surface layer aqueous carbon dioxide concentration was taken from the OceanSODA-ETHZ gridded monthly pCO2 climatology data product (Gregor and Gruber, 2021) multiplied by the Henry’s law constant (Weiss, 1974). This concentration was applied to mixed layer depths determined from the Holte et al. (2017) monthly climatology of mixed layer depths, with nearest neighbor interpolation used to fill in missing mixed layer depth values each month. By referencing expected changes in aqueous carbon dioxide concentration due to upwelling, [CO2]′, against the dynamic background concentration [CO2]ML(x,y,t), this model implicitly accounts for the myriad physical and biological factors that control air-sea gas fluxes in the absence of artificial upwelling.
Potential Mixed Layer Carbon Dioxide Concentration Due to Upwelling: [CO2]′
The potential aqueous carbon dioxide concentration of deep ocean water upwelled to the surface from depth z and subject the biogeochemical modification, [CO2]′, was calculated from the potential dissolved inorganic carbon and total alkalinity concentrations after upwelling, DIC′(z) and TA′(z), respectively, along with the salinity, S, at depth z and the potential temperature referenced to surface pressure, θ, using seacarb (Gattuso et al., 2020). DIC′(z) and TA′(z) can be expressed as follows:
where DIC(z) and TA(z) are the dissolved inorganic carbon and total alkalinity at depth z, respectively, from GLODAP (Lauvset et al., 2016); ΔDIC and ΔTA are the modeled biogeochemical modifications to DIC and TA, respectively, due to biological production; and ε expresses the effects of light limitation on ΔDIC and ΔTA.
Biogeochemical Modification of DIC and TA: Δ DIC and ΔTA
ΔDIC(z) and ΔTA(z) are the potential biogeochemical modification to DIC(z) and TA(z), respectively, made possible by the upwelling of nitrate ( ) and phosphate ( ) to the surface and the subsequent primary production these nutrients support. ΔDIC was modeled as a co-limitation between nitrate and phosphate as follows:
where g is the microalgae or macroalgae carbon-to-nitrogen-to-phosphorus (C:N:P) stoichiometry (see Table 1). ΔTA(z) was modeled as the uptake of nitrate (Brewer et al., 1975) in this co-limited system as follows:
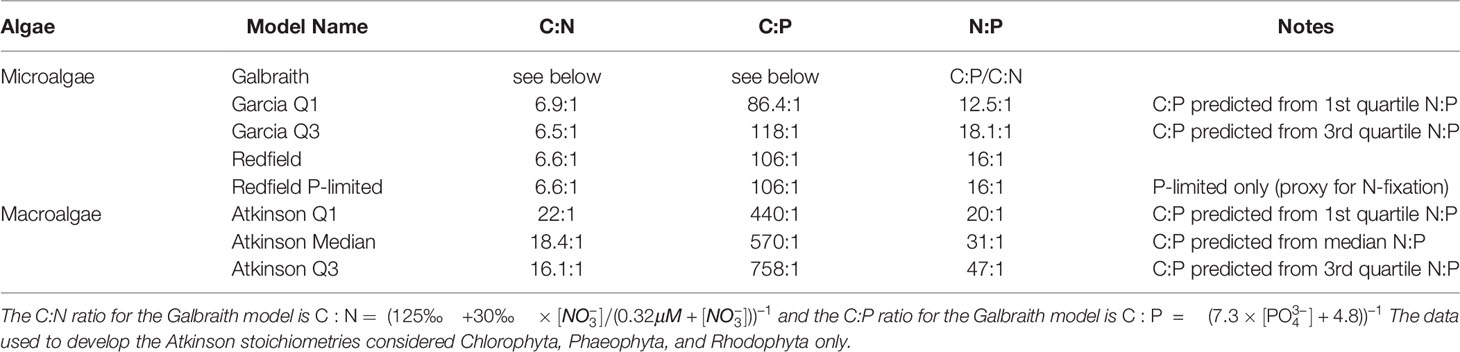
Table 1 Carbon-to-nitrogen-to-phosphorus (C:N:P) ratios for the macroalgae and microalgae considered in this study.
The stoichiometries come from published compilations of carbon-to-nitrogen-to-phosphorus ratios for microalgae and macroalgae assemblages. Data sources for microalgae stoichiometries included Galbraith and Martiny (2015) (“Galbraith”), Table 1 in Garcia et al. (2018) (“Garcia Q1” and “Garcia Q3”), and Redfield (1934) (“Redfield” and “Redfield P-limited”) for microalgae. The “Redfield P-limited” model is limited only by the availability of phosphorus to represent the possibility that nitrogen fixation could supplement primary production from artifical upwelling as hypothesized by Karl and Letelier (2008). Atkinson and Smith (1983) Table 1 is the data source for the three macroalgae stoichiometries (“Atkinson Q1”, “Atkinson Median”, and “Atkinson Q3”).
Light Limitation: ε
Light limitation was represented as a single coefficient, ε that ranged from 0 to 1 and expressed the relationship between between daily average downwelling irradiance at the ocean’s surface during the photoperiod at longitude x, latitude y, and month t and the light saturation parameter, Ek, which also varied spatially, temporally, and as a function of the type of algae (microalgae or macroalgae).
Where E(x,y,t) is the MODIS-Aqua Level 3 monthly climatology of photosynthetically active radiation at 9km resolution spanning the years 2002 to 2019/2020 (NASA, 2020) (data downloaded August 2020), regridded to 1°×1° using the cdo package (Schulzweida, 2019), and divided by the fraction of the day in the photoperiod, flight.
The light saturation parameter, Ek, applied to microalgae stoichiometries (Table 1) was determined from the Marine Primary Production: Model Parameters from Space (MAPPS) project (Bouman et al., 2018), where individual reported Ek measurements from the database were grouped by Longhurst biogeochemical province (Longhurst, 2010), hemisphere, and season, from which median values were taken for each of these groupings. Median values ranged from 40 to 370 μmol m-2 s-1. This grouping created seasonally-specific polygon groupings of Ek values which were then overlaid onto the 1°×1° grid.
The light saturation parameter, Ek, applied to macroalgae stoichiometries was held fixed at 125 μmol m-2 s-1 based on the consistency in reported values from red, green, and brown macroalgae (Johansson and Snoeijs, 2002; Gómez et al., 2004).
Global-Scale Estimates of Carbon Dioxide Removal Potential
For each microalgae and macroalgae stoichiometry in Table 1, monthly estimates of carbon dioxide removal potential were summed to generate annual scale estimates for each longitude x, latitude y, and depth z combination. At each longitude-latitude pairing, maximum annual carbon dioxide removal potential was selected among depths below the maximum annual mixed layer depth. These maximum carbon dioxide removal potential estimates were integrated across the area of the grid cell. Positive values of this areally-integrated maximum carbon dioxide removal potential estimate from each latitude-longitude pair were summed together to generate global-scale estimates of carbon dioxide removal potential. Negative values were excluded from the summation.
Results
Carbon Dioxide Removal Potential
Microalgae
Median areal flux rates of carbon dioxide removal potential from microalgae stoichiometries were calculated to range from 0.03 to 0.12 tons CO2 km-2 yr-1 under the constraint of an upwelling pipe no longer than 500 meters. Maximum areal flux rates ranged from 0.45 to 0.66 tons CO2 km-2 yr-1 (Figures 2, 3; Table 2). Approximately 90% to 95% of the grid cells were limited to less than 0.5 tons CO2 km-2 yr-1, with the exception of the Galbraith model which did not exceed 0.5 tons CO2 km-2 yr-1 under any conditions (Figure 3). The models showed some zonal variation with highest estimated rates of carbon dioxide removal poleward of 40° latitude in both hemispheres, especially in the Southern Ocean and in the north Pacific. The eastern equatorial Pacific also shows elevated carbon dioxide removal potential across the range of stoichiometries considered (Figure 2). In each of the microalgae models, between 2% and 14% of the model grid cells projected negative carbon dioxide removal (<0 tons CO2 km-2 yr-1), except for the Galbraith model for which 35% of the model grid cells projected negative carbon dioxide removal (Figure 3). Negative carbon dioxide removal potential was projected across the microalgae stoichiometries in portions of the eastern tropical north Pacific, the north Atlantic, and the western Indian Ocean (Figure 2).
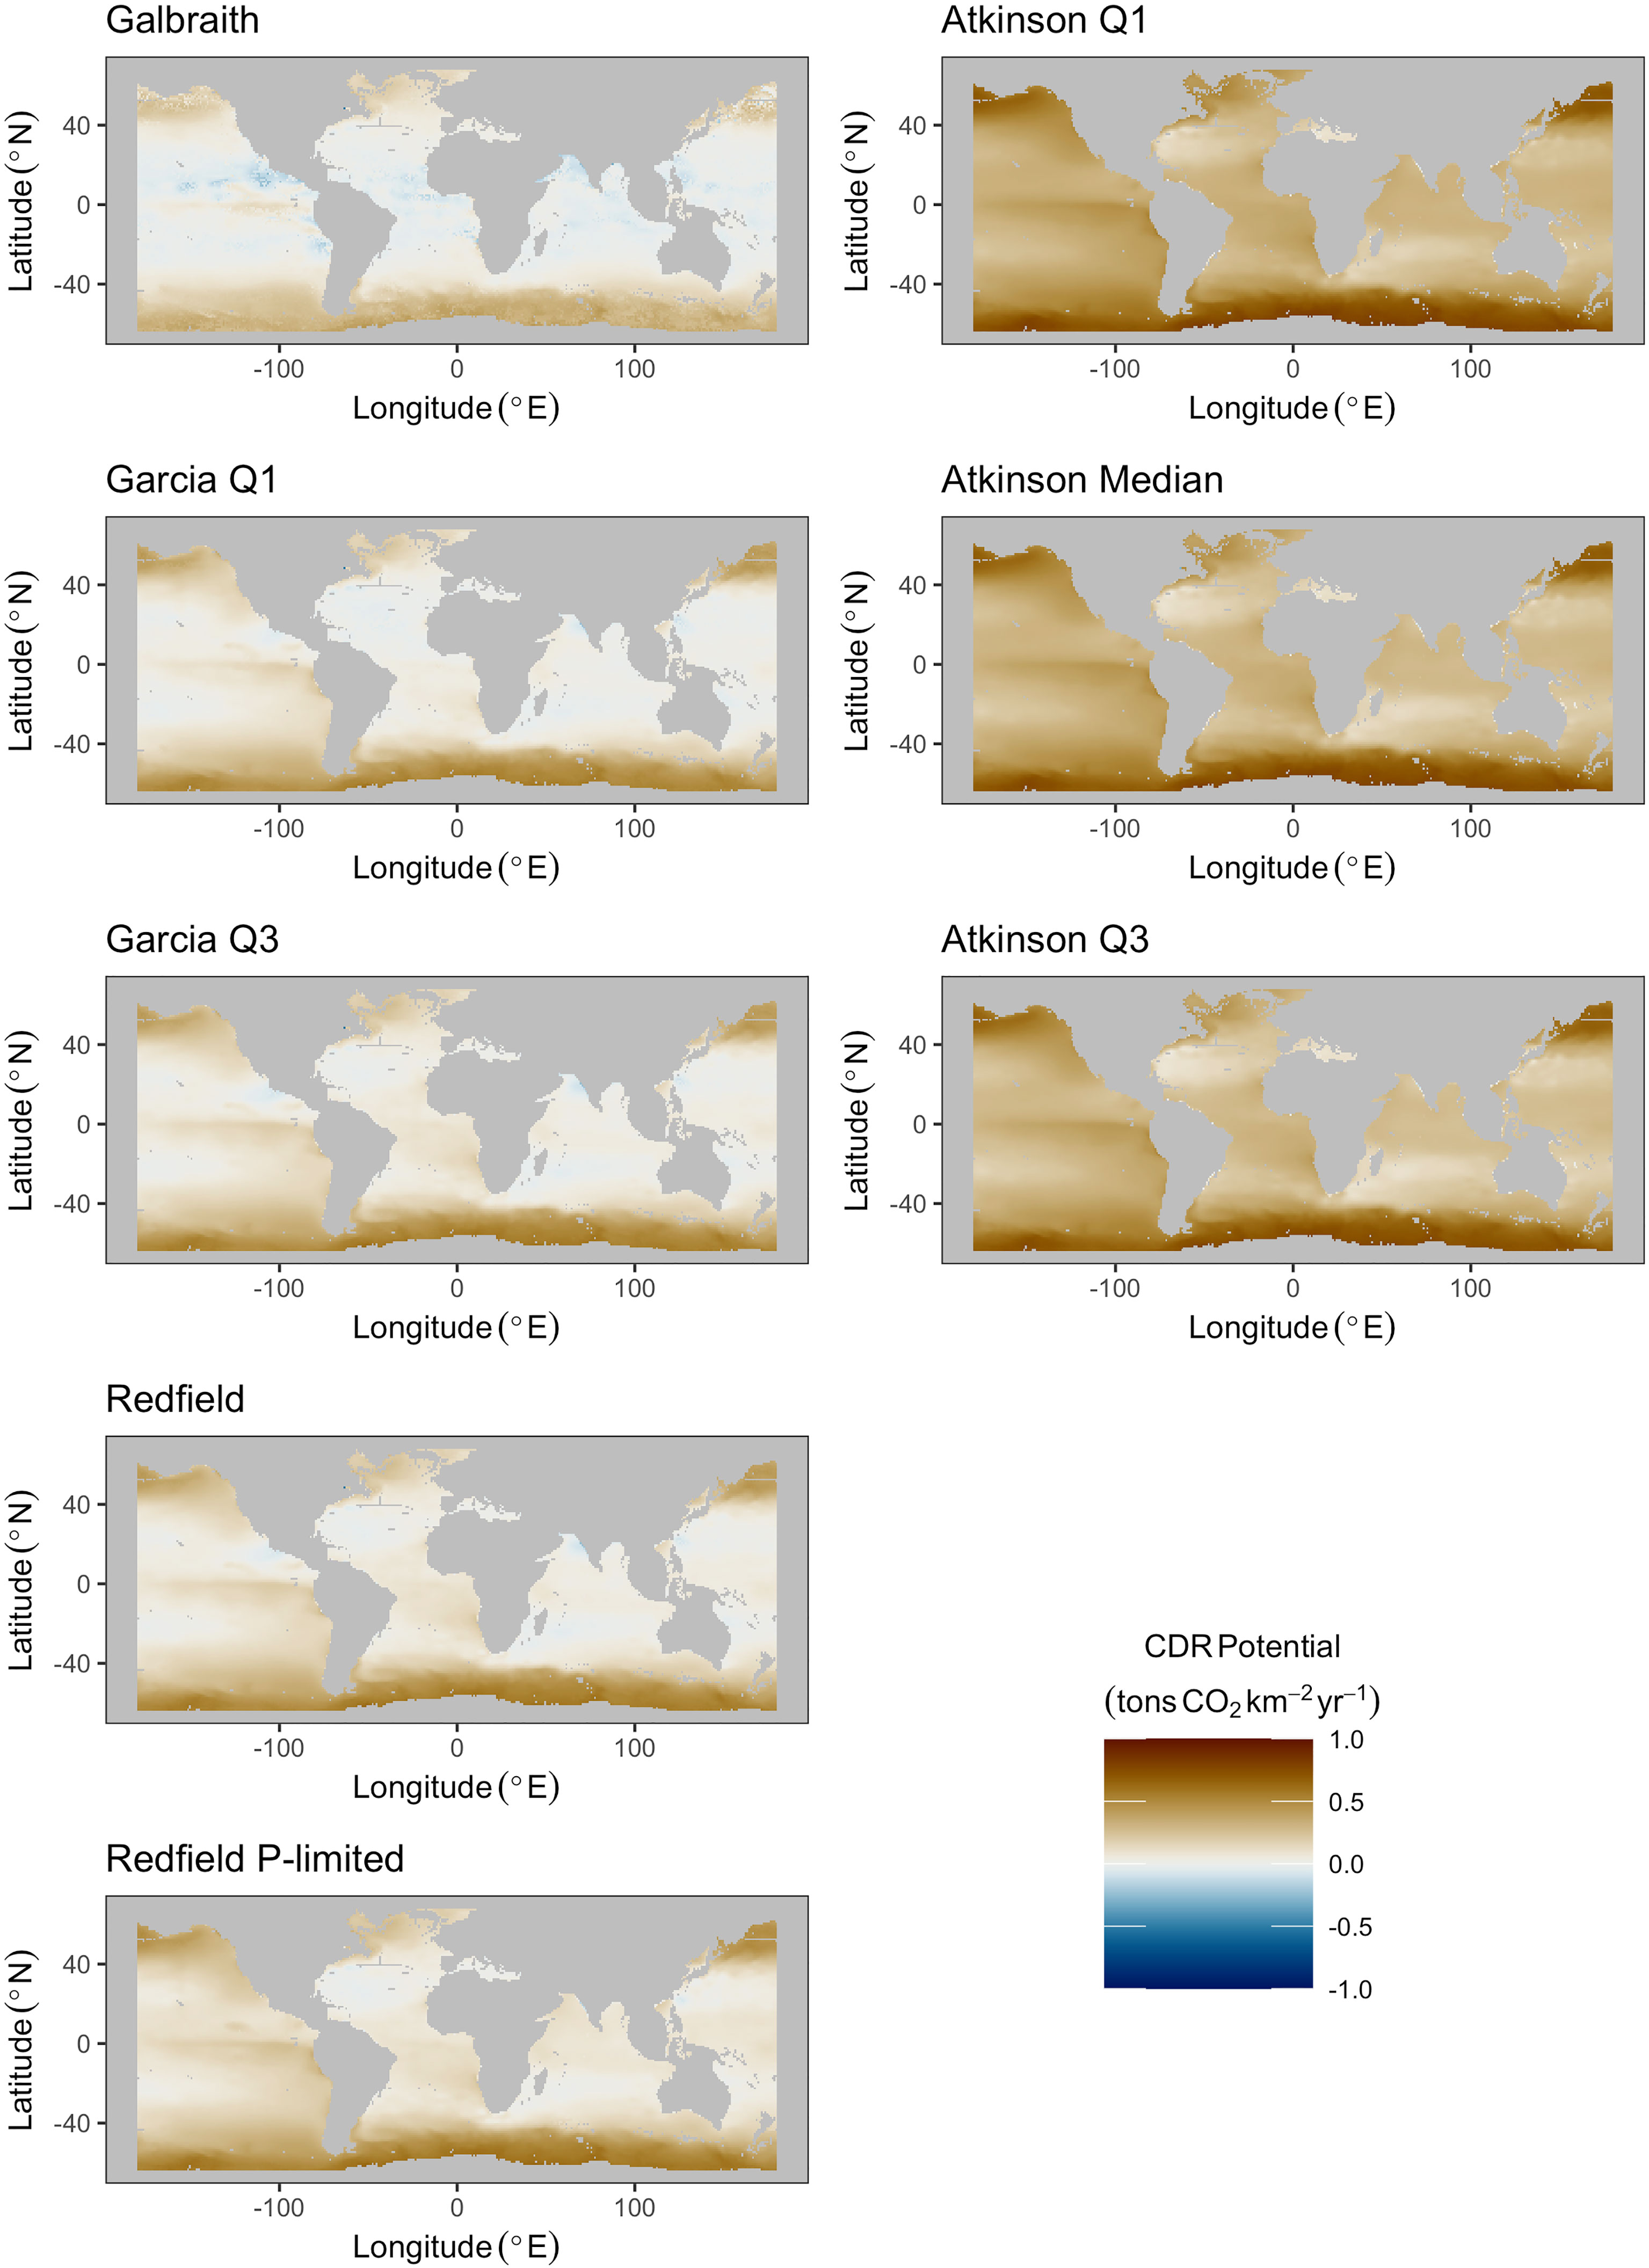
Figure 2 Maps of maximum potential carbon dioxide removal for all microalgae (left column) and macroalgae (right column) stoichiometries under the constraint of an upwelling pipe no longer than 500 meters.
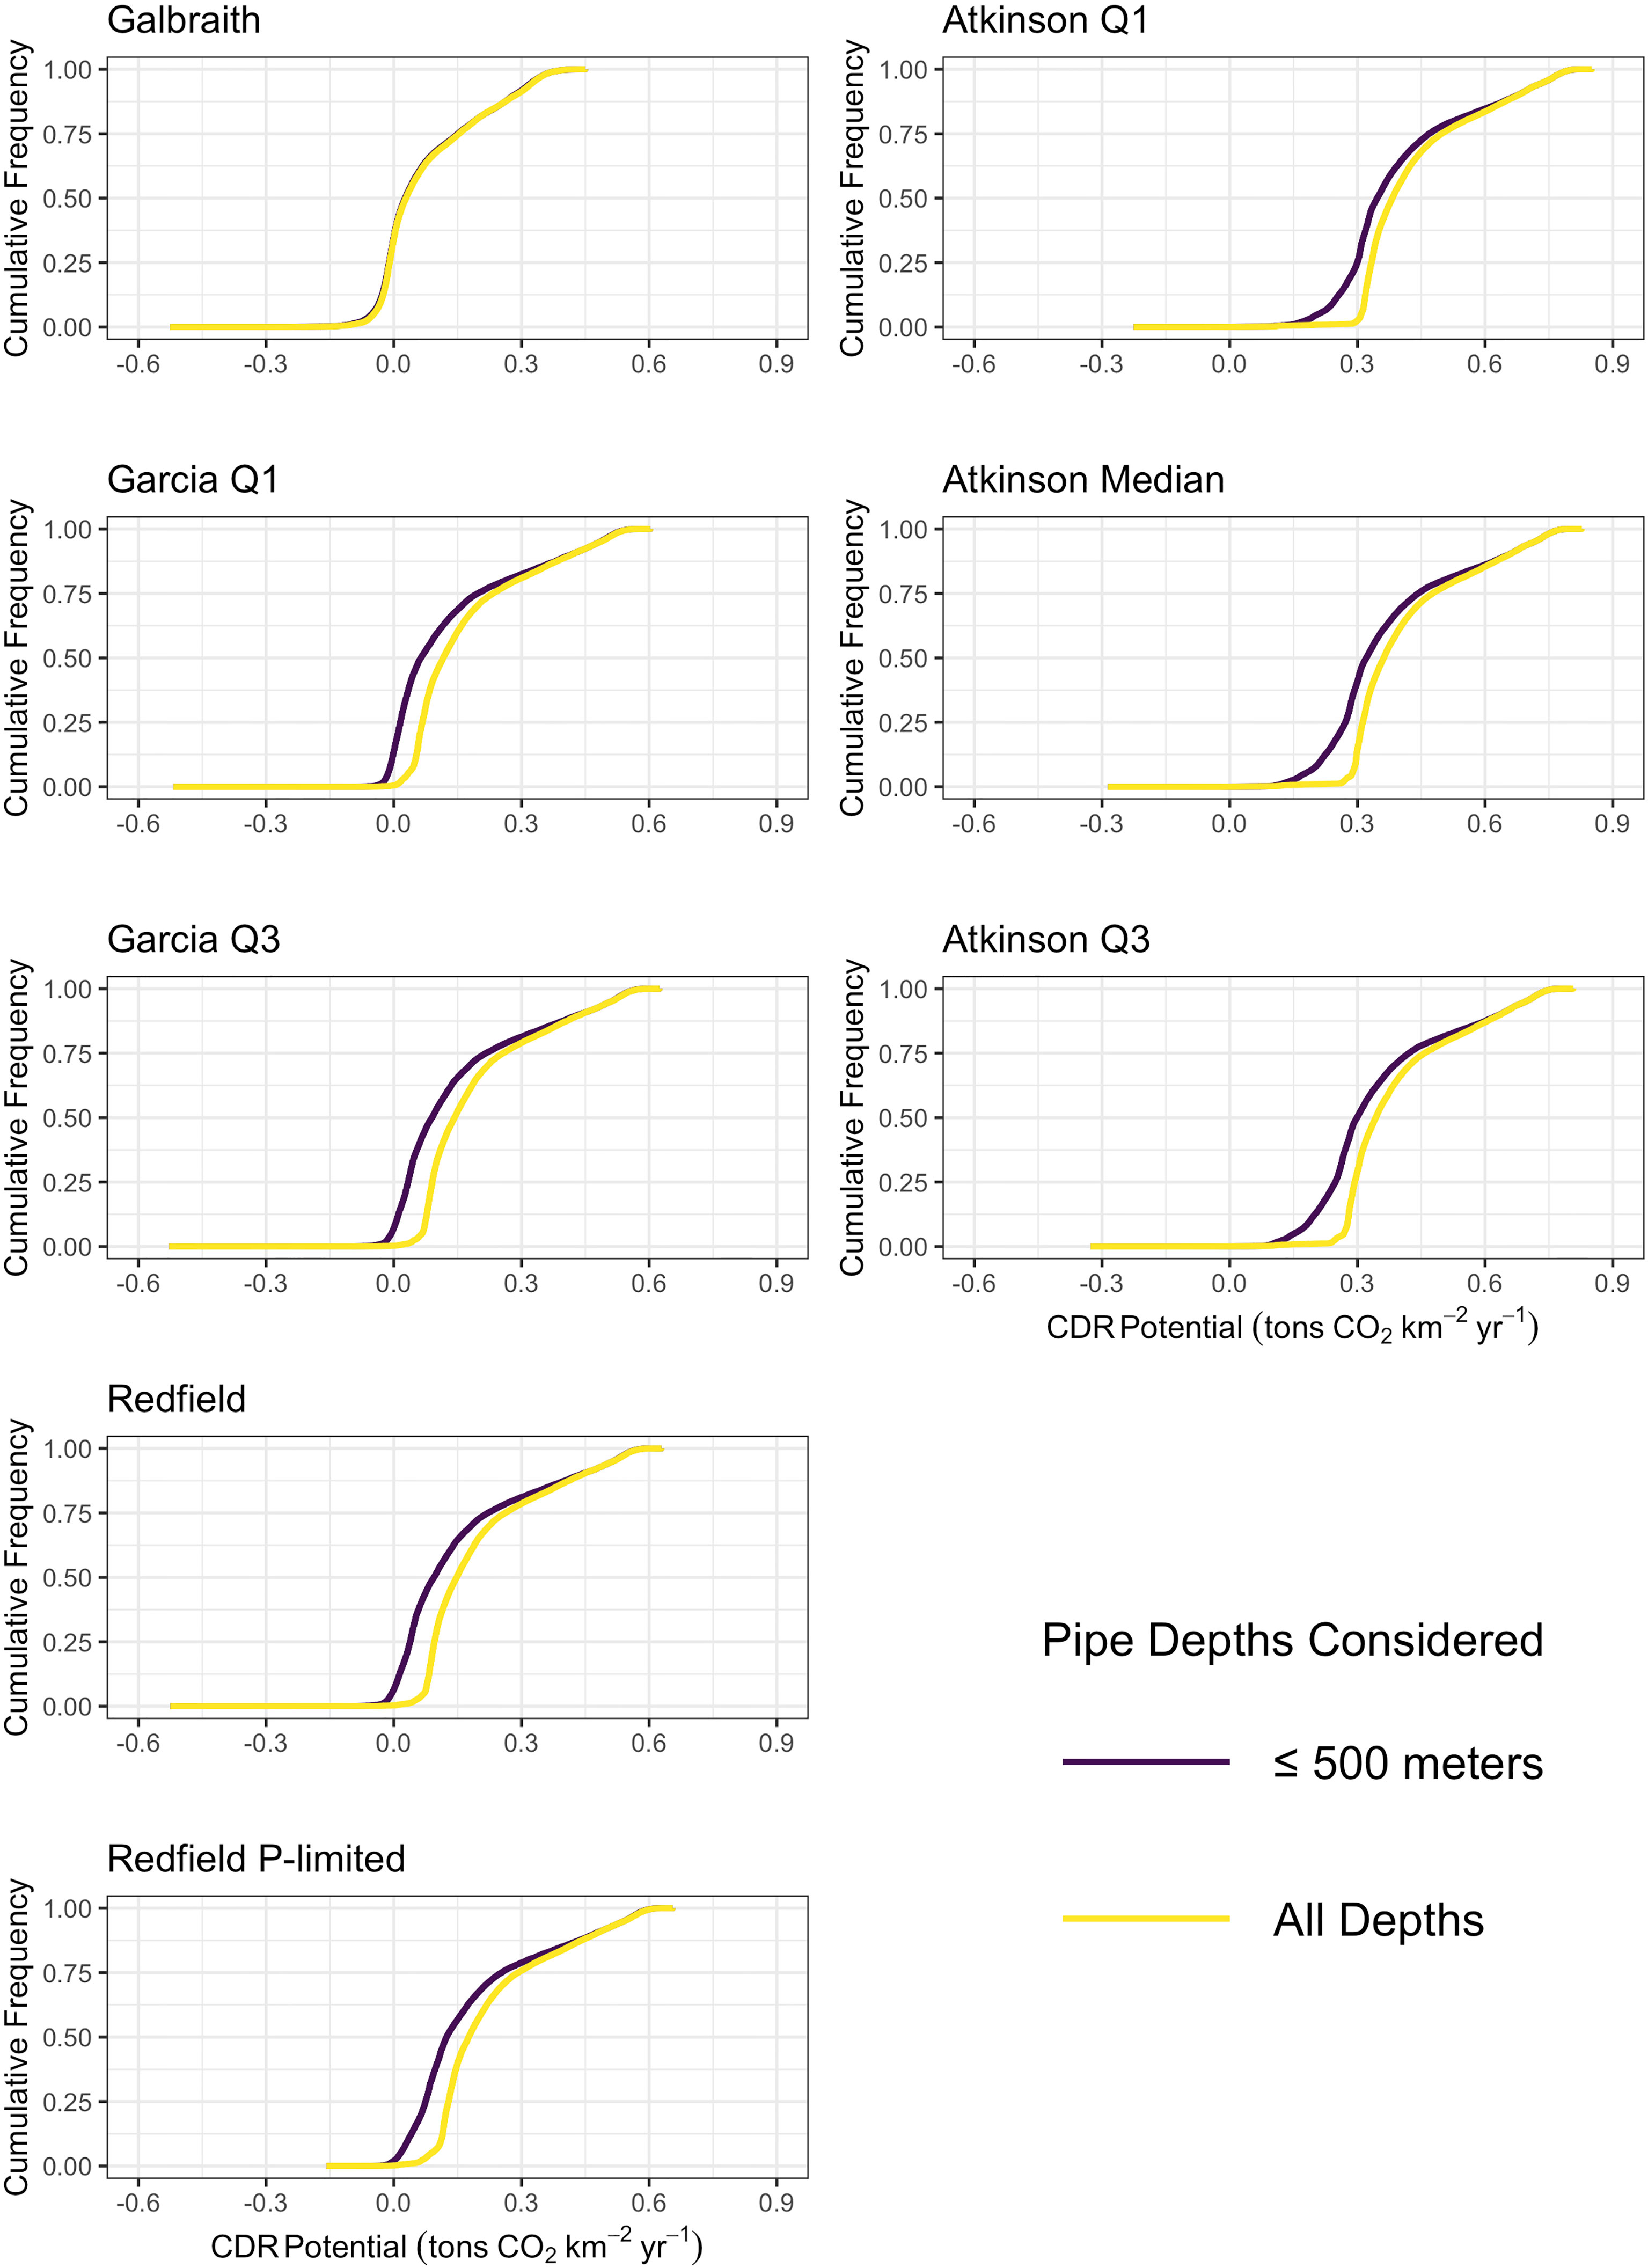
Figure 3 Empirical cumulative distribution functions of the maximum potential carbon dioxide removal for all microalgae (left column) and macroalgae (right column) stoichiometries with the constraint of an upwelling pipe no longer than 500 meters (dark purple) and without limits to the depth of the upwelling pipe (yellow).
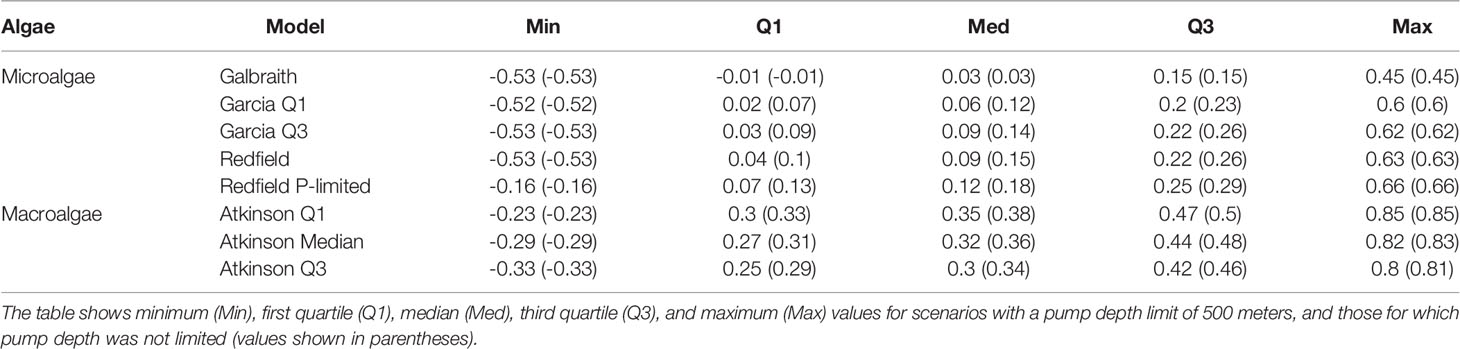
Table 2 Summary statistics of carbon dioxide removal potential from microalgae and macroalgae models across the global grid (tons CO2 km-2 yr-1).
In scenarios where the constraint of a 500 m long upwelling pipe was removed, carbon dioxide removal potential increased slightly across the grid, without substantial change to the spatial pattern (Figure S1) or distribution (Figure 3) of potential carbon dioxide removal from the depth-limited scenario. The depth of pumping required to generate maximum carbon dioxide removal potential exceeded 1000 meters, and reached 4000 to 5000 meters in much of the north Atlantic and north Pacific (Figure S2). That the depth of pumping corresponding to maximum carbon dioxide removal potential exceeded 500 meters indicates that pump length may become a limiting factor on the carbon dioxide removal potential of artificial upwelling. Relaxing the depth constraint eliminated nearly all grid cells projecting negative carbon dioxide removal potential. Model grids cells with projected negative carbon dioxide removal shrunk to between 0.2% and 0.5%, except for the Galbraith model which continued to project 34% of the model grid cells generating negative carbon dioxide removal (Figure 3). The persistence of grid cells with negative carbon dioxide removal potential in this scenario suggests that there are locations in the tropical-to-temperate ocean for which no scenario of artificial upwelling would be beneficial for the purposes of carbon dioxide removal.
Macroalgae
Median areal flux rates of carbon dioxide removal potential from macroalgae stoichiometries were calculated to range from 0.3 to 0.35 tons CO2 km-2 yr-1 under the constraint of an upwelling pipe no longer than 500 meters. Maximum areal flux rates ranged from 0.8 to 0.85 tons CO2 km-2 yr-1 and minimum areal flux rates ranged from -0.33 to -0.23 tons CO2 km-2 yr-1 in this scenario (Figures 2, 3; Table 2). However, unlike in the microalgae models, the percentage of grid cells in the macroalgae models exhibiting negative carbon dioxide removal potential was negligible (<0.05%). Similar to the microalgae models, greatest carbon dioxide removal potential was projected in the high latitudes of both hemispheres. Eastern boundaries of the south Atlantic and of the Pacific Oceans also showed elevated carbon dioxide removal potential. Elevated carbon dioxide removal potential was projected across much of the eastern equatorial Pacific (Figure 2).
In scenarios where the constraint on the depth of the upwelling pipe was removed, projected carbon dioxide removal potential increased across the grid and became more spatially homogeneous across the mid-latitudes (Figure S1). In particular, increases in carbon dioxide removal potential were projected for the western margin of the major ocean basins. Maximum carbon dioxide removal was projected when pumping from depths of between 1000 and 2000 meters across most of the major ocean basins (Figure S2). The exception to this rule came from the north Atlantic where maximum carbon dioxide removal potential was forecast to come from pumping up from depths of 4000 to 5000 meters. The increased projected carbon dioxide removal serves as evidence that current technological limits on the feasibility of deploying pipes into the deep ocean for artificial upwelling limit carbon dioxide removal potential from macroalgae, although this limitation is typically not more than 0.04 tons CO2 km-2 yr-1 (Table 2).
Global-Scale Potential
Microalgae
Global aggregated carbon dioxide removal potential from microalgae was calculated to be less than 50 megatons, or 0.05 gigatons, of carbon dioxide per year under the technological constraint of a 500 m length upwelling pipe (Figure 4).When this technological constraint was removed, potential carbon dioxide removal increased by between 10 and 15 megatons (0.01-0.015 gigatons) of carbon dioxide per year across all microalgae stoichiometries, except the Galbraith model for which there was a negligible difference (less than one megaton of carbon dixoide per year) (Figure 4). In contrast to the other microalgae models, the Galbraith model predicted that the pumping depth for maximum carbon dioxide removal potential would be less than 500 m across much of the tropical-to-subpolar ocean (Figure S2). Therefore, removing the technological constraint of a 500 m long upwelling pipe had less impact on the estimates of carbon dioxide removal potential than on other stoichiometries, all of which showed that the depth of pumping for maximal carbon dioxide removal often exceeds 500 meters depth.
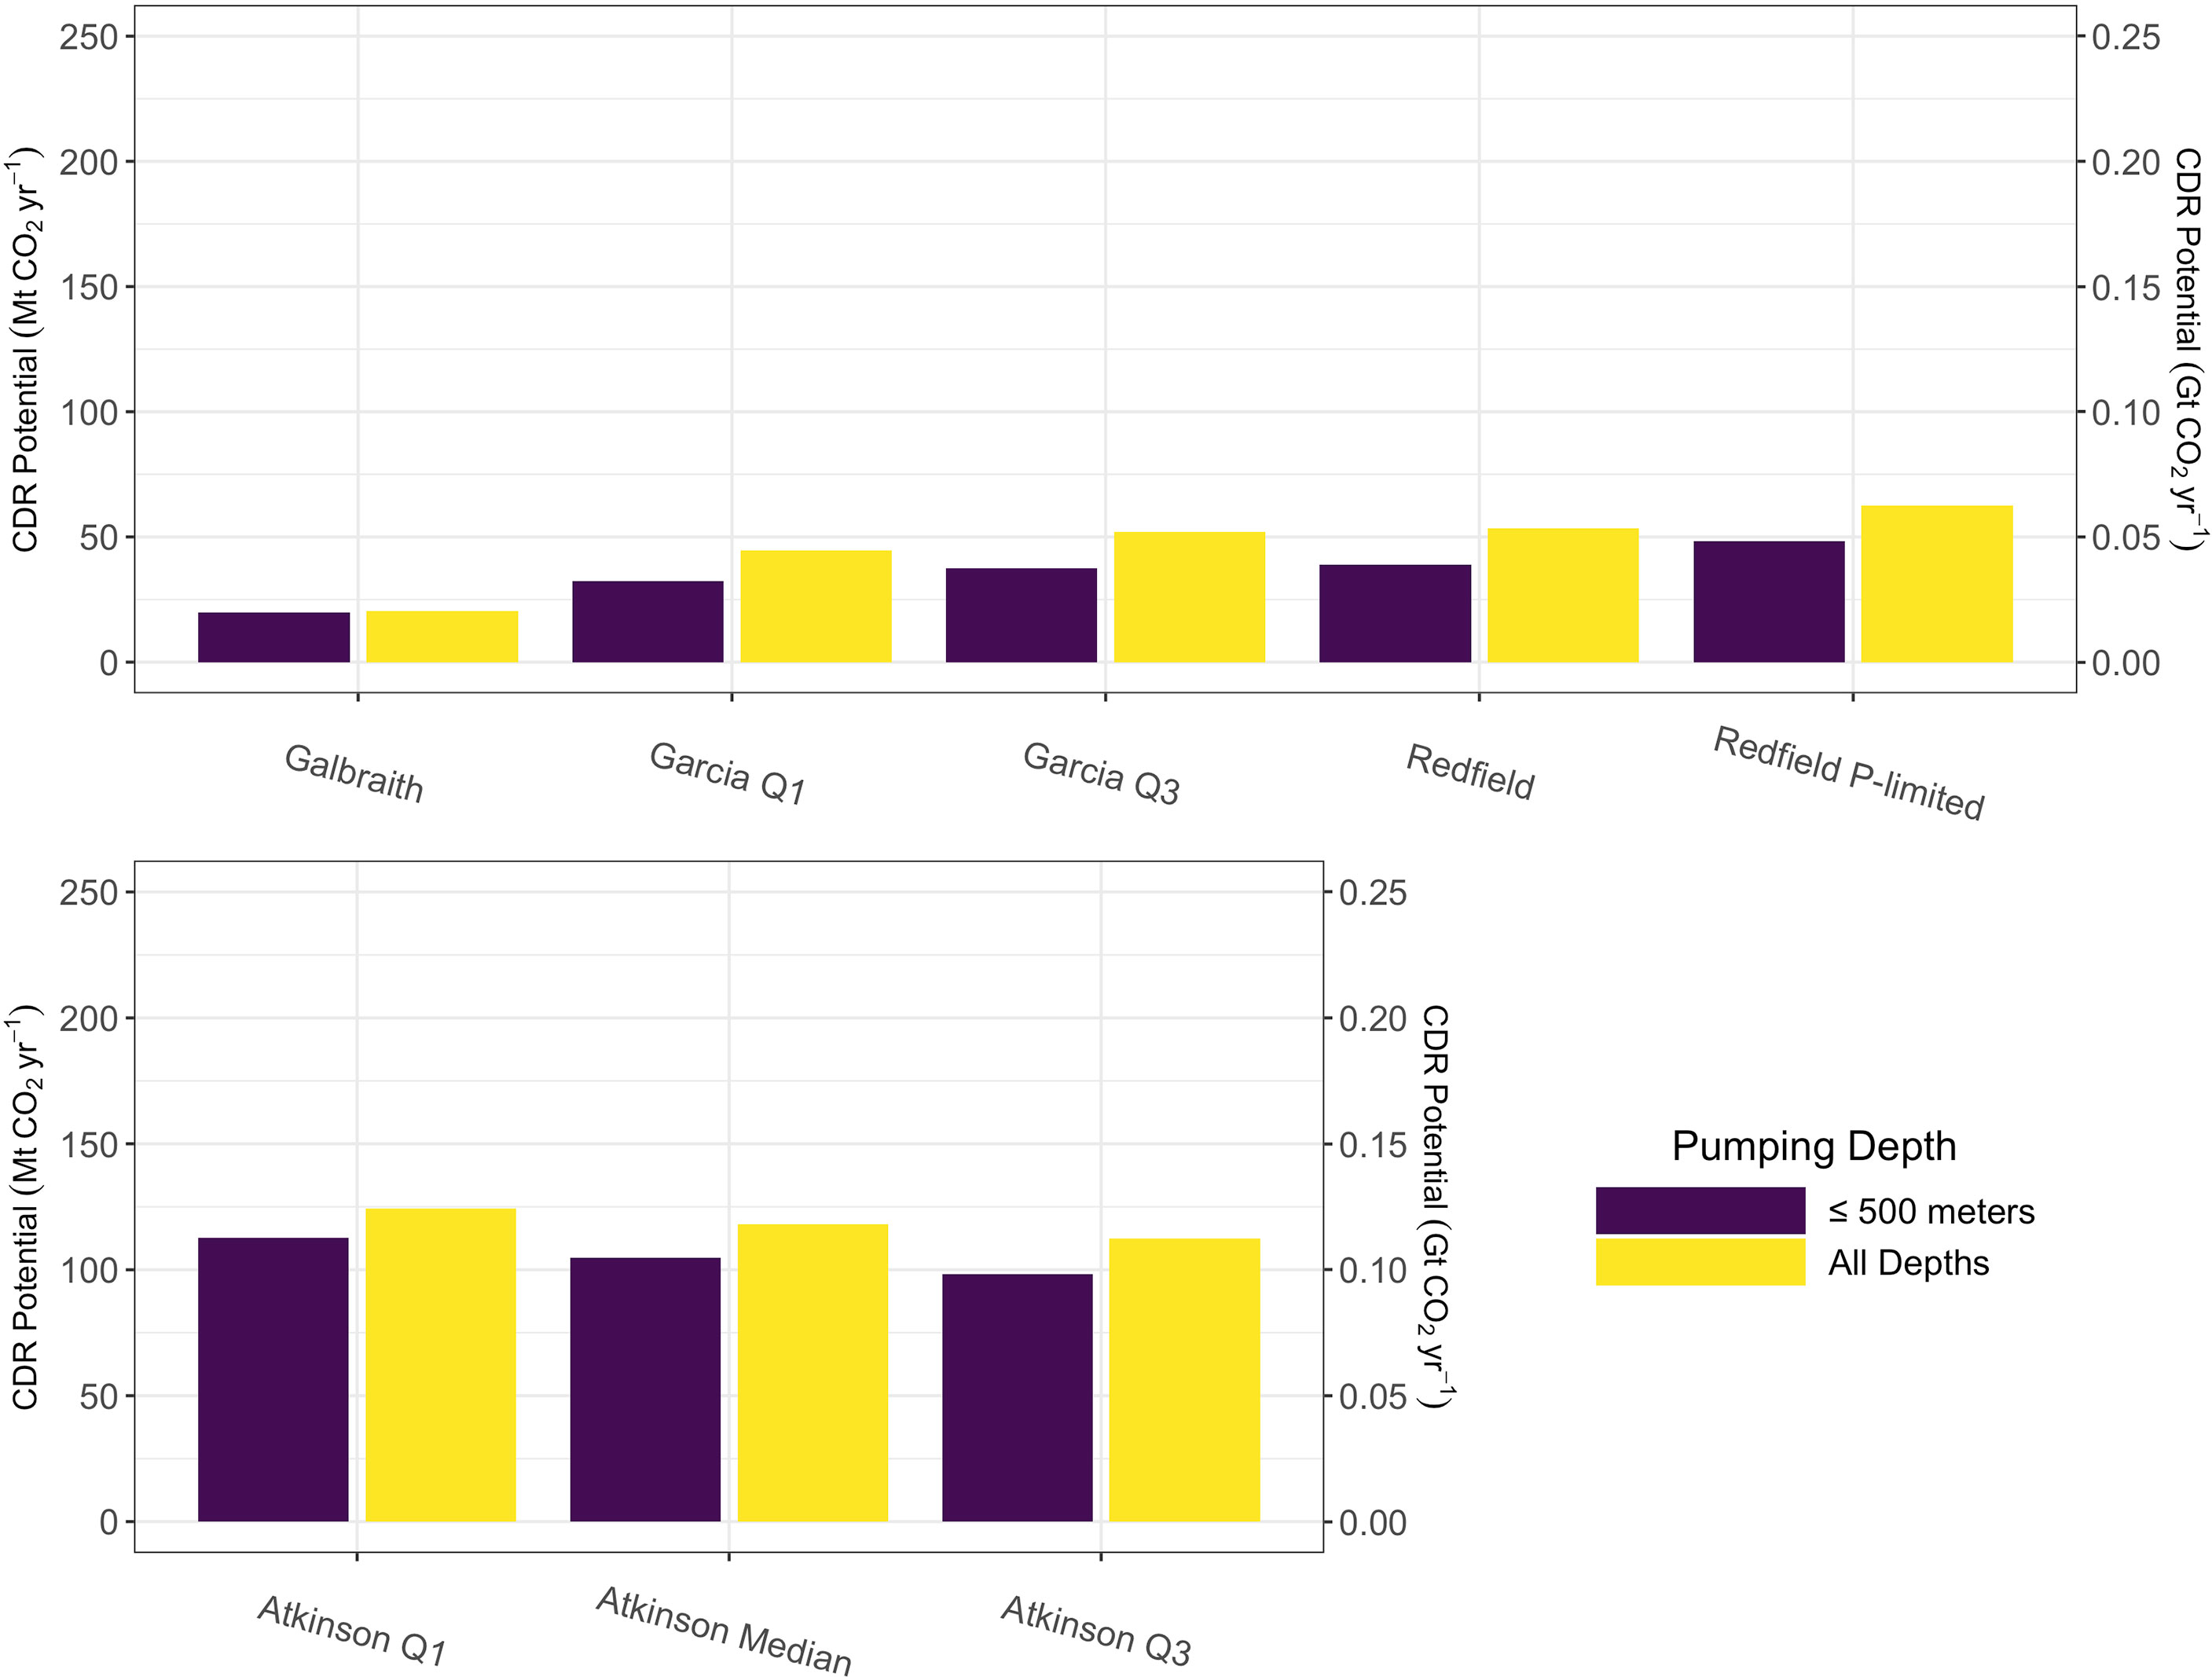
Figure 4 Projected global-scale carbon dioxide removal potential after areally integrating positive potential carbon dioxide removal values from Figure 2 (purple) and Figures S1 (yellow) for microalgae stoichiometries (top row) and macroalgae stoichiometries (bottom row).
Macroalgae
Global aggregated carbon dioxide removal potential for macroalgae stoichiometries was calculated to be between 98 and 113 megatons (0.098 to 0.113 gigatons) of carbon dioxide per year under the technological constraint of a 500 m length upwelling pipe (Figure 4). Removing the depth limit on the pipe resulted in an increase of approximately 10 to 15 megatons of carbon dioxide per year across all macroalgae stoichiometries (Figure 4).
Controls on Carbon Dioxide Removal Potential
Biogeochemical modification of deep ocean water by microalgae was co-limited by nitrate and phosphate availability. Distributions of nitrate-to-phosphate from locations and depths corresponding to maximum carbon dioxide removal potential without constraints on maximum pump depth (Figures S1, S2) demonstrated phosphate-limitation for the Garcia Q1 model, nitrate-limitation for the Garcia Q3 and Redfield models, and co-limitation by nitrate and phosphate in the Galbraith model (Figure 5). The Redfield P-limited model was phosphate-limited by design (see Table 1). In contrast, all three macroalgae models were nitrate-limited (Figure 5).
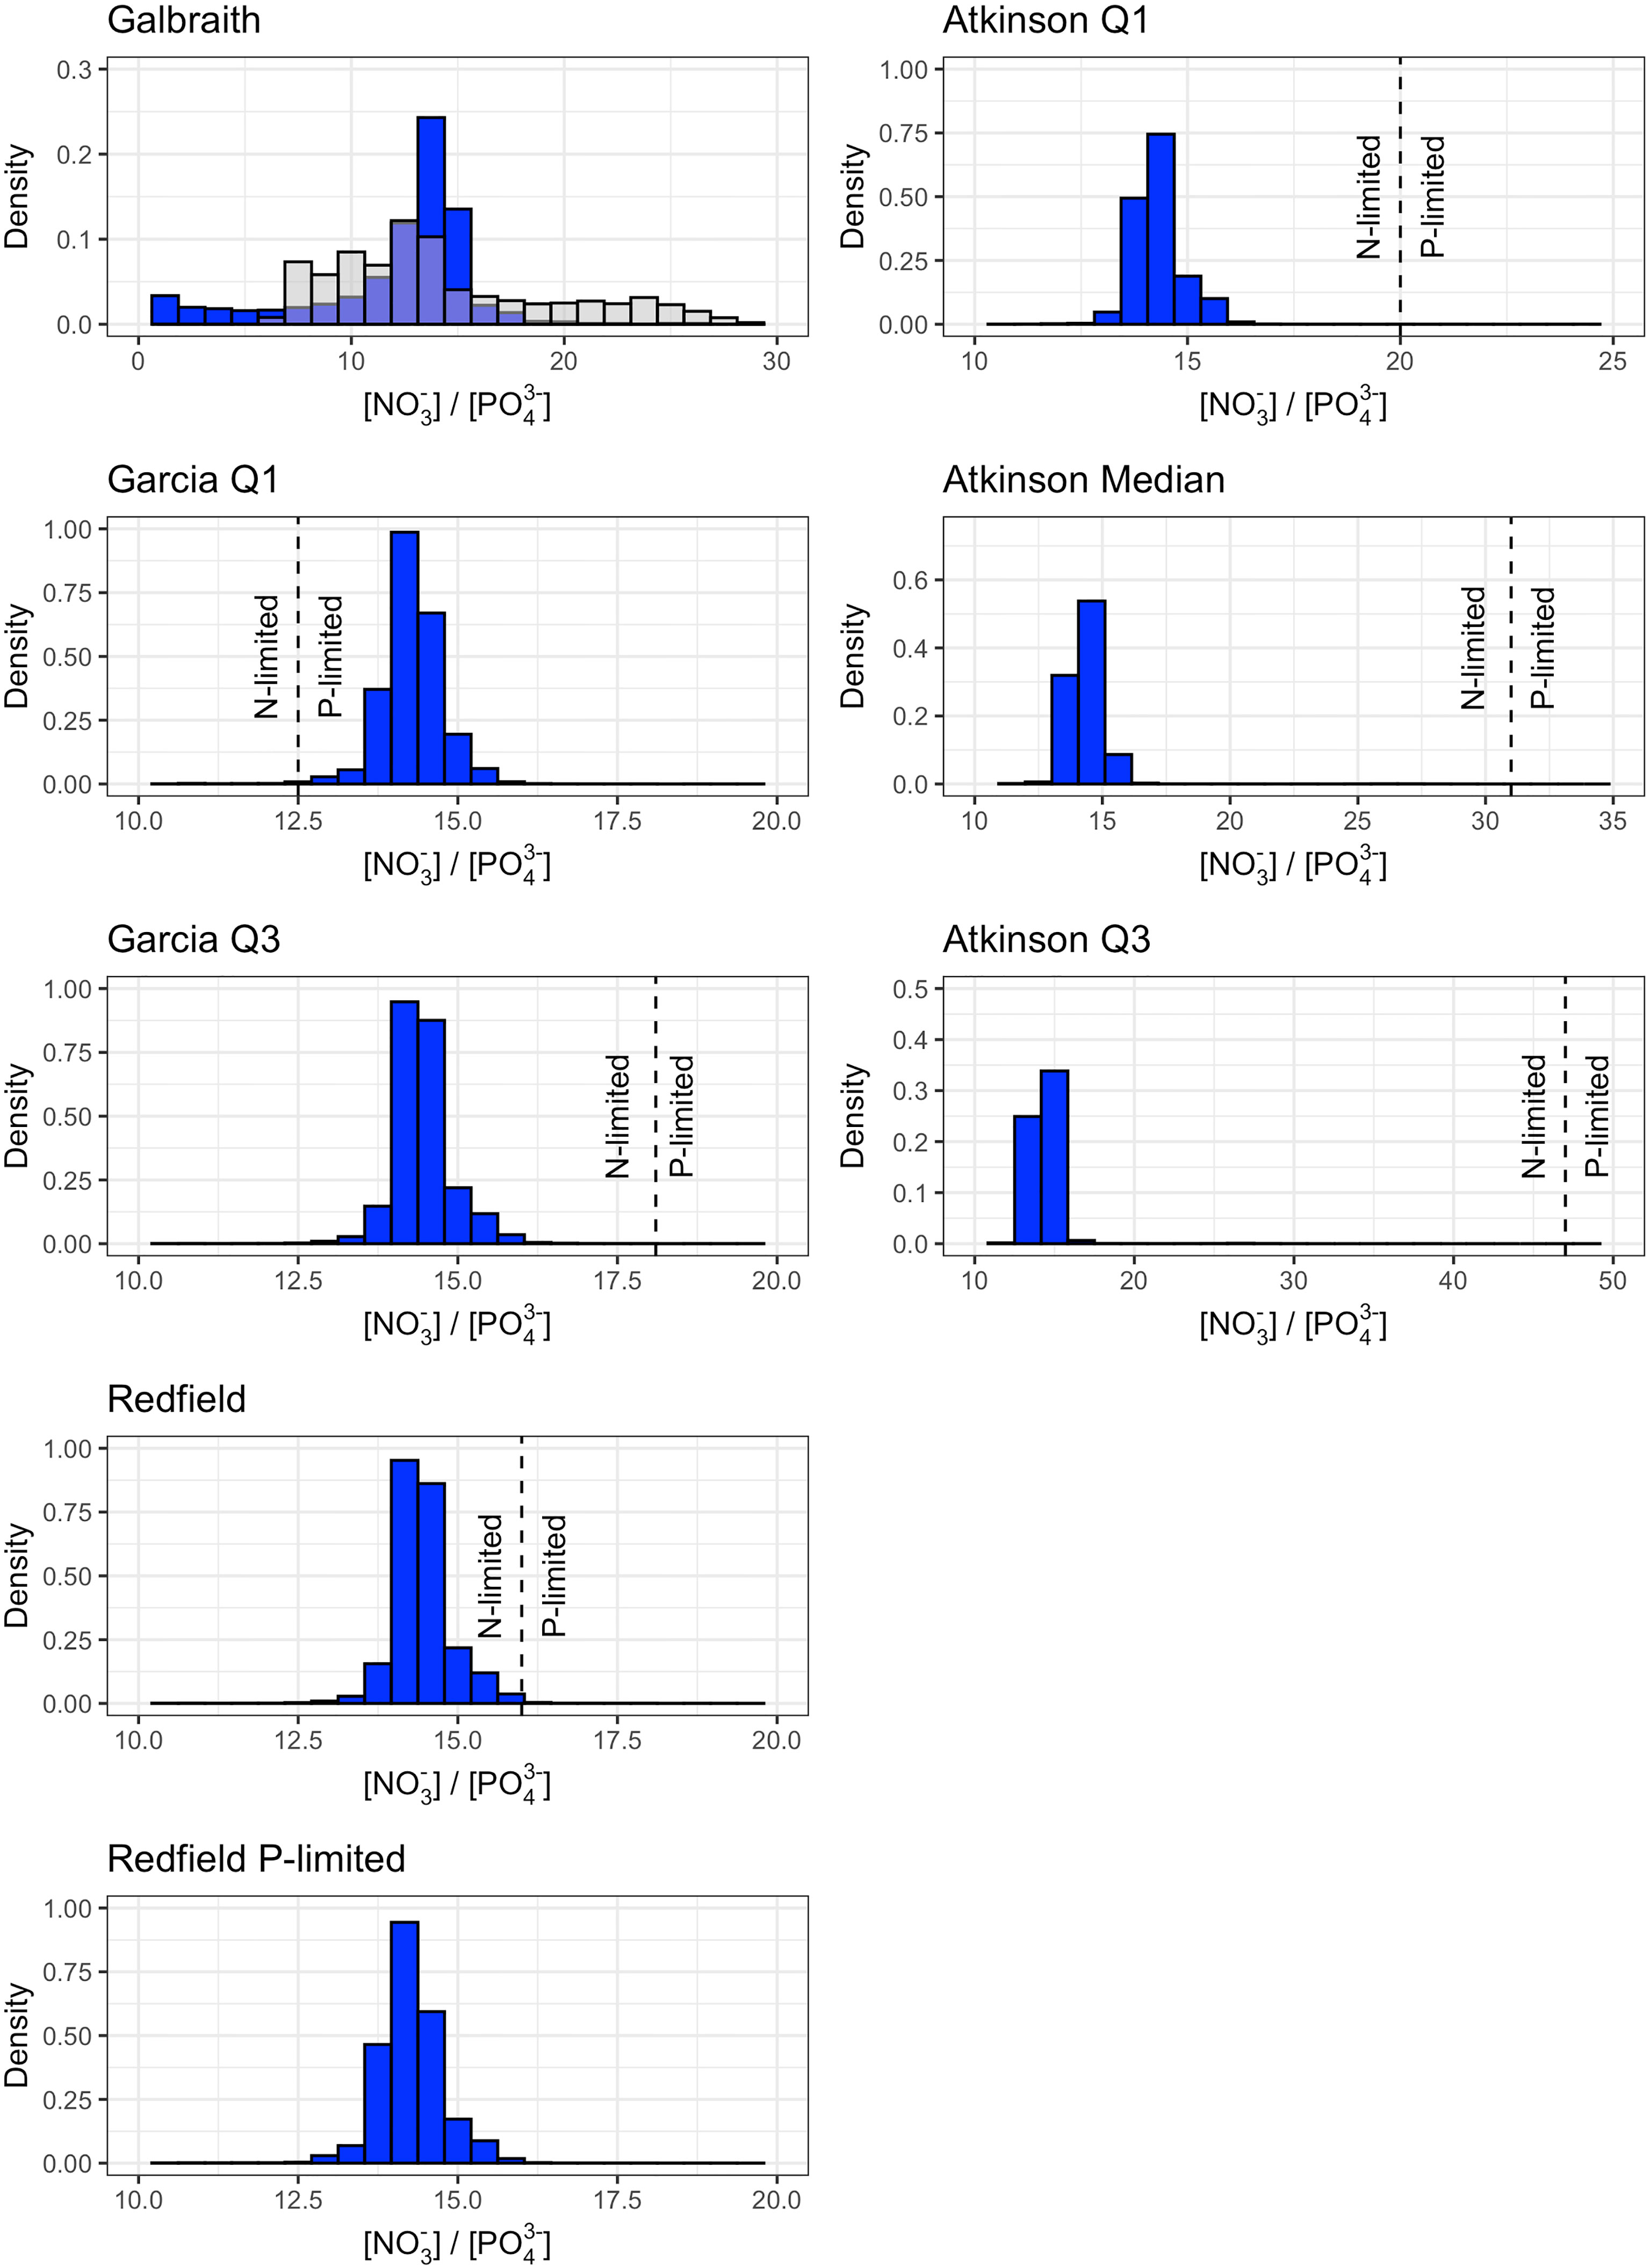
Figure 5 Density histograms of the nitrate-to-phosphate ratio corresponding to maximum carbon dioxide removal potential shown in Figure S1 for microlage (left column) and macroalgae (right column) stoichiometries. Dashed lines show the nitrogen-to-phosphorus stoichiometry of the microalgae or macroalgae (Table 1). Values to the left of the dashed line are nitrogen-limited and values to the right of the dashed line are phosphate-limited. The nitrogen-to-phosphorus stoichiometry of the Galbraith model are shown as the grey overlaying histogram. The nitrogen-to-phosphorus stoichiometry of the Redfield P-limited model is not shown because biogeochemical uptake is limited by phosphate availability only. Axis limits are adjusted between plots to facilitate visualization of the density histograms and their relationship to the nitrogen-to-phosphorus stoichiometry.
Carbon dioxide removal potential in this study can be explained as linear functions of the ratio of carbon to the limiting nutrient(s) (Figure 6). As carbon-to-nutrient ratios in microalgae and macroalgae increase, more carbon is removed per unit nutrients consumed. Microalgae carbon-to-nutrient ratios were represented as the product of carbon-to-nitrogen and carbon-to-phosphorus ratios to reflect the limitation of both nitrate and phosphate on biogeochemical uptake across the suite of microalgae stoichiometries considered. Macroalgae models, being limited by nitrate alone, were explained as a linear function of macroalgae carbon-to-nitrogen ratios across the stoichiometries considered.

Figure 6 Controls on carbon dioxide removal potential of microalgae (left panel) and macroalgae (right panel). Grey dashed lines show linear models for each type of algae. Carbon-to-nitrogen and carbon-to-phosphorus values for the Galbraith model were chosen by calculating values for all locations and depths displayed in Figure S2 and selecting the median values of carbon-to-nitrogen and carbon-to-phosphorus from the distributions.
Discussion
This study presents estimates of the potential for carbon dioxide removal from artificial upwelling by using a simple model to project the capacity of artificial upwelling to decrease surface ocean aqueous carbon dioxide concentration. By incorporating a range of observationally-informed carbon-to-nitrogen-to-phosphorus ratios for microalgae communities and for macroalgae (Table 1), the simple model can investigate the potential for carbon dioxide removal across a realistic range of possible carbon-to-nutrients ratios. Comparison of the results across the different nutrient stoichiometries serves as a means to analyze the sensitivity of the model results to any assumed carbon-to-nitrogen-to-phosphorus ratio.
This study projects that carbon dioxide removal potential across the tropical-to-subpolar ocean is always less than 1 ton CO2 km-2 yr-1 and that global-scale deployment of pipes uniformly deployed at a spacing of one pipe per square kilometer across the tropical-to-subpolar ocean would yield carbon dioxide removal of substantially less than one gigaton of carbon dioxide removal annually. Simulations across a range of assumed microalgae growth stoichiometries without limits on upwelling pipe depth resulted in estimates between 20 and 62 megatons (0.02 to 0.062 gigatons) of potential carbon dioxide removal annually, while simulations across a range of macroalgae growth stoichiometries without limits on upwelling pipe depth resulted in estimates between 98 and 124 megatons (0.098 to 0.124 gigatons) of potential carbon dioxide removal annually. Technological limitations, taken in this study as a maximum pipe depth of 500 meters, are responsible for a reduction of 10 to 15 megatons of potential carbon dioxide removal per year from the theoretical maximum if pipe depth was not a limiting factor (except for the Galbraith model) (Figure 4). Under a wide array of microalgae and macroalgae stoichiometries, this study projects that the expected decrease of surface ocean carbon dioxide concentration due to increased primary production from artificial upwelling is largely offset by the effects of upwelling deep ocean water with high concentrations of carbon dioxide.
Study Assumptions
There are a number of assumptions in this study worthy of further consideration. First, this study considers carbon dioxide removal potential from the point of carbon dioxide fixation via photosynthesis. It does not consider losses due to remineralization of organic matter in the surface ocean. If organic matter is not rapidly harvested or exported to the deep ocean, remineralization during export will reduce the efficiency and permanence of carbon dioxide removal from artificial upwelling by returning a large portion of carbon embedded in the biomass back to dissolved carbon dioxide (Baumann et al., 2021; Siegel et al., 2021). By not considering remineralization, this study likely overestimates the quantity and permanence of carbon dioxide removal from artificial upwelling.
There are a number of ideas being considered to reduce surface ocean remineralization of newly produced macroalgae. There is growing interest and exploration in the idea of intentionally sinking macroalgae biomass (GESAMP, 2019; Energy Futures Initiative, 2020; Ocean Visions, 2021) in the deep ocean to sequester the embedded carbon from return to the atmosphere. Recent research suggest that the deep ocean may offer sequestration permanence on timescales of decades-to-millenia depending upon the location where the biomass is sunk and the depth to which it is sunk (Siegel et al., 2021). A second option for macroalgae would involve harvesting the macroalgae for later use as a source of energy coupled with carbon capture and storage (Moreira and Pires, 2016), or for use as a source of energy where the carbon remains in an inert form such as biochar (Roberts et al., 2015).
Microalgae presents unique challenges for ensuring sequestration due to their diffuse concentration and neutral buoyancy in seawater. Coupling artificial upwelling pipes to adjacent artificial downwelling pipes may provide one route for rapid export of additional microalgae biomass into the deep ocean. Downwelling pipes would need to be a different length than the coupled upwelling pipe to avoid running a closed loop by which the same water parcel is repeatedly upwelled and downwelled without a chance to drawdown atmospheric carbon dioxide in the surface ocean and export newly produced organic matter to the deep ocean.
Second, this study assumes that the change in surface ocean concentration of aqueous carbon dioxide is a reliable indicator of carbon dioxide removal potential because any deficits in surface ocean concentration of aqueous carbon dioxide would be replenished by invasion of atmospheric carbon dioxide. However, changes in aqueous carbon dioxide concentration may only result in uptake of atmospheric carbon dioxide if the carbon dioxide-depleted water remains at the surface long enough for the atmosphere to equilibrate with the surface water. As Bach et al. (2021) showed, carbon dioxide-depleted surface water in the vicinity of the Great Atlantic Sargassum Belt is not exposed to the atmosphere long enough for atmospheric carbon dioxide to invade the surface ocean and re-equilibrate the air-sea equilibrium. In these instances of insufficient equilibration, carbon dioxide removal potential is reduced from the upper bound created by the air-sea concentration gradient. This study does not resolve area(s) of the tropical-to-subpolar ocean over which incomplete equilibration is expected, but one can safely assume that inclusion of this process would reduce the global total estimates of carbon dioxide removal provided here (Figure 4).
Third, this study does not consider changes in the vertical structure of the upper water column due to artificial upwelling. The upwelling of deep ocean water from below the winter mixed layer depth into the surface mixed layer will tend to reduce the thermal and haline gradients between the surface ocean and the deep ocean, resulting in reduced stratification between the two layers (Fennel, 2008). This breakdown in stratification accelerates with higher rates of deep water upwelling, but can be inhibited by absorption of solar radiation on the ocean’s surface, which heats the surface layer and strengthens stratification (Letelier et al., 2008). Reduced stratification may allow for greater diffusion of high carbon dioxide deep ocean water into the surface mixed layer. These diffusive fluxes of carbon dioxide from within the pycnocline into the mixed layer could offset any drawdown in surface ocean aqueous carbon dioxide caused by upwelling-induced primary production, resulting in diminished estimates of the carbon dioxide removal potential of artificial upwelling.
Fourth, this study relies on monthly climatologies alone to predict annual estimates of carbon dioxide removal potential. It does not resolve sub-monthly variability, nor does it resolve carbon dioxide removal potential on interannual timescales. As such, the carbon dioxide removal potential estimated in this study should serve as an average estimate for a given location, as well as on a global-scale, subject to modification as upper ocean conditions change due to changes in temperature, salinity, surface ocean chemistry, mixed layer depth, and incoming solar radiation.
Fifth, this study focuses on macronutrient fertilization alone. It does not consider the role of micronutrients, such as iron, in supporting enhanced biological productivity. This is a simplification of the model because it is well-established that many regions of the ocean are micronutrient-limited, such as the well-known high-nutrient low-chlorophyll regions (Moore et al., 2013). Excluding micronutrients may bias the carbon dioxide removal potentials presented here to be higher than actually expected. However, this bias may be fully or partially negated because artificial upwelling would translocate micronutrients from depth to the surface alongside macronutrients. For instance, dissolved iron concentration increases with depth consistently across much of the world’s major ocean basins (Moore and Braucher, 2008). Regardless, nutrient fertilization is modeled in this study as co-limitation (the least abundant nutrient dictates the extent of new biological production). Incorporating one or more additional co-limiters (e.g., dissolved iron) would result in decreased estimates of the carbon dioxide removal potential of artificial upwelling.
Comparisons With Earth System Modeling Studies
This study estimates carbon dioxide removal potential in each grid cell independent of both past levels of artificial upwelling and other parts of the Earth system. In contrast, past artificial upwelling studies estimated the carbon dioxide removal potential within an Earth system model (Dutreuil et al., 2009; Yool et al., 2009; Oschlies et al., 2010; Keller et al., 2014). While the approach in this study is simpler, and allows for incorporation of recent high resolution (1°×1°) observationally-informed climatologies, it has two main drawbacks relative to Earth system modeling studies. First, Earth system models evolve processes forward in time, such that the past state of a process affects future values. This is a more realistic representation of any intervention as its effects accumulate through space and time (although not all of these models simulate the changes in upper ocean mixing described above due to the required additional complexity of the simulations). By projecting forward in time, Earth system models can address questions that this model is ill-suited to address, such as how using deep ocean nutrients through artificial upwelling may affect nutrient availability to support primary production in downstream ecosystems (the “opportunity cost” of artificial upwelling on biological productivity).
The second drawback of this model relative to Earth system models is that Earth system models allow for exchange of carbon between the ocean, atmosphere, and land, and thus are able to simulate Earth system feedback from artificial upwelling. All carbon dioxide removal pathways are expected to induce Earth system feedbacks that counteract the drawdown of atmospheric carbon dioxide as the various reservoirs of the global carbon cycle re-equilibrate. These feedbacks dictate the ultimate efficacy of any carbon dioxide removal pathway in drawing down atmospheric carbon dioxide concentrations (Cao and Caldeira, 2010; Jones et al., 2016; Keller et al., 2018). For instance, Jones et al. (2016) showed in an Earth system model that the fraction of a given quantity of carbon dioxide removal which remained out of the atmosphere ranged from 55% to 89% (depending upon the RCP scenario) as the global carbon cycle re-equilibrated to a quantity of atmospheric removal.
The spatially-resolved (Figure 2) and global summed (Figure 4) carbon dioxide removal potential are linearly dependent on the areal mean upwelling rate, which is the product of the areal density of pipes, npipes, and the volumetric flow rate per pipe, . At npipes = 1 km-2 and = 0.05 m3 s-1, the areal mean upwelling rate in this study was approximately 0.4 centimeters per day. For comparison, areal mean upwelling rates in Oschlies et al. (2010) and Keller et al. (2014) were one centimeter per day, and the areal mean upwelling rate in Yool et al. (2009) was two centimeters per day. If the areal mean upwelling rates from the Earth system modeling studies were used in this study, it would increase the carbon dioxide removal potential by a factor of 2.5 (one centimeter per day) or 5 (two centimeters per day). This would increase the estimates of carbon dioxide removal potential for microalgae to between 50 and 310 megatons (0.05 to 0.31 gigatons) annually, and would increase the carbon dioxide removal potential for macroalgae to between ~250 and 625 megatons (0.250 to 0.625 gigatons) annually. These scaled estimates would fall within the range of -0.13 to 0.38 gigatons of microalgae carbon dioxide removal per year projected by Yool et al. (2009). But the scaled estimates would still fall well short of the projected ~3.3 gigatons of carbon dioxide removal per year reported by Oschlies et al. (2010) and of the 6.1 to 13.2 gigatons of carbon dioxide removal per year projected by Keller et al. (2014). However, these discrepancies may not be as large as they may first appear. Oschlies et al. (2010) found that cooling of surface waters due to artificial upwelling depressed land-based respiration, which represented ~80% of the additional carbon storage in their model simulations. This leaves ~0.66 of the 3.3 total gigatons of carbon dioxide removal per year reported by Oschlies et al. (2010) as sequestered in the ocean sink. This study can only estimate uptake potential by the ocean, so a direct comparison between the two studies would find that the estimates of ocean uptake from artificial upwelling in this study are approximately one-sixth that of Oschlies et al. (2010). While this discrepancy clearly leaves room for further investigation, it does not represent a difference of orders of magnitude as it might have initially appeared.
In the short term, two cross-checks between this model and Earth system models could help validate or invalidate the results of this study. First, by incorporating the realistic technical feasibility of pipe performance featured in this study (maximum depth of 500 meters, ) into Earth system model simulations. Second, by applying this simple diagnostic model to Earth system model output. Regardless of future modeling work, the inconsistencies in reported values between Earth system modeling studies underscore the need for complementary approaches (mesocosms, field tests) to evaluate the efficacy of artificial upwelling for carbon dioxide removal.
Final Thoughts on Study Limitations
Despite its limitations, the simple modeling framework introduced in this study facilitates rapid testing of the upper bound on the potential for carbon dioxide removal from artificial upwelling across a wide range of carbon-to-nitrogen-to-phosphorus ratios for microalgae and macroalgae communities. By considering the near-term technological limits on operational capacities of upwelling pumps, this study helps ground the near-term potential of artificial upwelling to contribute to the removal of atmospheric carbon dioxide. As higher-resolution oceanographic data products and climatologies become available, they can replace the data products used in this study for higher spatial and temporal resolution estimates of the carbon dioxide removal potential from artificial upwelling. Multiple modeling approaches, alongside experimental and observational studies, are likely to provide the most holistic perspective about the range of possible outcomes from artificial upwelling.
Futher Considerations
At the flow rate considered within each pipe here (0.05 m3 s-1), pipe areal density would need to increase by approximately an order of magnitude to npipes ~ 10 km-2 across the study area to reach gigaton-scale carbon dioxide removal. Substantial technological developments would be needed to reach this areal density because current field trials have been restricted to single pipe studies over short timescales (days-to-weeks) (Pan et al., 2016).
This study may aid in the site selection of experimental programs by identifying sites with large ranges in carbon dioxide removal potential from artificial upwelling, such as in the eastern equatorial Pacific or along the northern boundary of the Southern Ocean among others (Figure 2). These sites, which feature large variations in carbon dioxide removal potential over small spatial distances, may prove valuable for experimental programs because they may provide an opportunity to ground truth both upper end and lower end carbon dioxide removal estimates from artificial upwelling.
Environmental impacts from artificial upwelling need to be carefully studied in addition to carbon dioxide removal potential. Possible impacts include whether, and how, artificial upwelling may change phytoplankton community competition via changes in temperature, salinity, nutrients, carbon dioxide, and/or light; and the effects of these changes on marine food webs and carbon export efficiency (Pan et al., 2016; Taucher et al., 2021). Large-scale implementation of artificial upwelling may impact sea surface temperatures with consequences for local circulation, weather, and climate (Kwiatkowski et al., 2015). The Ocean artUp program (https://ocean-artup.eu/) is conducting mesocosm and field experiments, as well as modeling studies to better characterize the environmental impacts (both positive and negative) of artificial upwelling. Observational studies of natural upwelling systems for their carbon sequestration potential may also offer valuable insights into the efficacy of artificial upwelling and its impacts on marine ecosystems (Bach and Boyd, 2021).
Conclusion
Gigaton-scale carbon dioxide removal is now required under the shared socioeconomic pathways that limit warming to <2°C above the pre-industrial (IPCC, 2021). Ocean-based pathways may play a valuable role in supplying the needed carbon dioxide removal because of their size, potential for fewer conflicting use needs, and potential advantages with respect to permanence (Siegel et al., 2021). This study suggests artificial upwelling is unlikely to provide gigaton-scale carbon dioxide removal because enhanced biological production supported by deep water nutrients are largely offset by the correlated release of carbon dioxide from deep ocean water, even before considering inefficiencies from remineralization of newly produced organic matter. Controlled field trials are needed to validate or invalidate the findings of this study and other artificial upwelling modeling studies.
Data Availability Statement
Instructions, code, and data necessary to reproduce the results of this study are freely available at: https://doi.org/10.5281/zenodo.6604122.
Author Contributions
The author confirms being the sole contributor of this work and has approved it for publication.
Conflict of Interest
The author declares that the research was conducted in the absence of any commercial or financial relationships that could be construed as a potential conflict of interest.
Publisher’s Note
All claims expressed in this article are solely those of the authors and do not necessarily represent those of their affiliated organizations, or those of the publisher, the editors and the reviewers. Any product that may be evaluated in this article, or claim that may be made by its manufacturer, is not guaranteed or endorsed by the publisher.
Acknowledgments
I thank the reviewers for their helpful comments that improved this manuscript. I thank Lydia Kapsenberg for her helpful comments which greatly improved this manuscript before submission. This study was inspired by my participation in the scoping workshops for Uncharted Waters: Expanding the Options for Carbon Dioxide Removal in Coastal and Ocean Environments. I thank the workshop co-chairs, Brad Ack and Greg Rau, as well as the Energy Futures Initiative, for the invitation to participate.
Supplementary Material
The Supplementary Material for this article can be found online at: https://www.frontiersin.org/articles/10.3389/fmars.2022.841894/full#supplementary-material
References
Atkinson M. J., Smith S. V. (1983). C:N:P Ratios of Benthic Marine Plants. Limnol. Oceanog. 28, 568–574. doi: 10.4319/lo.1983.28.3.0568
Bach L. T., Boyd P. W. (2021). Seeking Natural Analogs to Fast-Forward the Assessment of Marine CO2 Removal. Proc. Natl. Acad. Sci. 118, e210614718. doi: 10.1073/pnas.2106147118
Bach L. T., Tamsitt V., Gower J., Hurd C. L., Raven J. A., Boyd P. W. (2021). Testing the Climate Intervention Potential of Ocean Afforestation Using the Great Atlantic Sargassum Belt. Nat. Commun. 12, 1–10. doi: 10.1038/s41467-021-22837-2
Baumann M., Taucher J., Allanah J. P., Heinemann M., Vanharanta M., Bach L. T., et al. (2021). Effect of Intensity and Mode of Artificial Upwelling on Particle Flux and Carbon Export. Front. Mar. Sci. 8. doi: 10.3389/fmars.2021.742142
Bouman H. A., Platt T., Doblin M., Figueiras F. G., Gudmundsson K., Gudfinnsson H. G., et al. (2018). Photosynthesis-Irradiance Parameters of Marine Phytoplankton: Synthesis of a Global Data Set. Earth Sys. Sci. Data 10, 251–266. doi: 10.5194/essd-10-251-2018
Brewer P. G., Wong G. T. F., Bacon M. P., Spencer D. W. (1975). An Oceanic Calcium Problem? Earth Planet. Sci. Lett. 26, 81–87. doi: 10.1016/0012-821X(75)90179-X
Cao L., Caldeira K. (2010). Atmospheric Carbon Dioxide Removal: Long-Term Consequences and Commitment. Environ. Res. Lett. 5, 0–6. doi: 10.1088/1748-9326/5/2/024011
Dutreuil S., Bopp L., Tagliabue A. (2009). Impact of Enhanced Vertical Mixing on Marine Biogeochemistry: Lessons for Geo-Engineering and Natural Variability. Biogeosciences 6, 901–912. doi: 10.5194/bg-6-901-2009
Energy Futures Initiative (2020). Uncharted Waters: Expanding the Options for Carbon Dioxide Removal in Coastal and Ocean Environments. Washington, DC, United States.
Fennel K. (2008). Widespread Implementation of Controlled Upwelling in the North Pacific Subtropical Gyre Would Counteract Diazotrophic N2 Fixation. Mar. Ecol. Prog. Ser. 371, 301–303. doi: 10.3354/meps07772
Forsythe W. C., Rykiel E. J., Stahl R. S., Wu H.-i., Schoolfield R. M. (1995). A Model Comparison for Daylength as a Function of Latitude and Day of Year. Ecol. Model. 80, 87–95. doi: 10.1016/0304-3800(94)00034-F
Galbraith E. D., Martiny A. C. (2015). A Simple Nutrient-Dependence Mechanism for Predicting the Stoichiometry of Marine Ecosystems. Proc. Natl. Acad. Sci. Unite. States America 112, 8199–8204. doi: 10.1073/pnas.1423917112
Garcia N. S., Sexton J., Riggins T., Brown J., Lomas M. W., Martiny A. C. (2018). High Variability in Cellular Stoichiometry of Carbon, Nitrogen, and Phosphorus Within Classes of Marine Eukaryotic Phytoplankton Under Sufficient Nutrient Conditions. Front. Microbiol. 9. doi: 10.3389/fmicb.2018.00543
Gattuso J.-P., Epitalon J.-M., Lavigne H., Orr J. (2020) Seacarb: Seawater Carbonate Chemistry. Available at: https://cran.r-project.org/package=seacarb.
Gattuso J.-P., Magnan A. K., Bopp L., Cheung W. W. L., Duarte C. M., Hinkel J., et al. (2018). Ocean Solutions to Address Climate Change and its Effects on Marine Ecosystems. Front. Mar. Sci. 5. doi: 10.3389/FMARS.2018.00337
Gattuso J.-P., Williamson P., Duarte C. M., Magnan A. K. (2021). The Potential for Ocean-Based Climate Action: Negative Emissions Technologies and Beyond. Front. Mar. Sci. 2. doi: 10.3389/fclim.2020.575716
GESAMP (2019). High Level Review of a Wide Range of Proposed Marine Geoengineering Techniques. Eds. Boyd P. W., Vivian C. M. G. (London, England: IMO/FAO/UNESCO-IOC/UNIDO/WMO/IAEA/UN/UN Environment/ UNDP/ISA Joint Group of Experts on the Scientific Aspects of Marine Environmental Protection).
Gómez I., López-Figueroa F., Ulloa N., Morales V., Lovengreen C., Huovinen P., et al. (2004). Patterns of Photosynthesis in 18 Species of Intertidal Macroalgae From Southern Chile. Mar. Ecol. Prog. Ser. 270, 103–116. doi: 10.3354/meps270103
Gregor L., Gruber N. (2021). OceanSODA-ETHZ: A Global Gridded Data Set of the Surface Ocean Carbonate System for Seasonal to Decadal Studies of Ocean Acidification. Earth Sys. Sci. Data 13, 777–808. doi: 10.5194/essd-13-777-2021
Gruber N., Clement D., Carter B. R., Feely R. A., van Heuven S., Hoppema M., et al. (2019). The Oceanic Sink for Anthropogenic CO2 From 1994 to 2007. Science 363, 1193–1199. doi: 10.1126/science.aau5153
Holte J., Talley L. D., Gilson J., Roemmich D. (2017). An Argo Mixed Layer Climatology and Database. Geophys. Res. Lett. 44, 5618–5626. doi: 10.1002/2017GL073426
IPCC (2018). “Summary for Policymakers,” in Global Warming of 1.5°C. An Ipcc Special Report on the Impacts of Global Warming of 1.5°C Above Pre-Industrial Levels and Related Global Greenhouse Gas Emission Pathways, in the Context of Strengthening the Global Response to the Threat of Climate Change. Eds. Masson-Delmotte V., Zhai P., Pörtner H.-O., Roberts D., Skea J., Shukla P. R., et al. Geneva, Switzerland. 32.
IPCC (2021). “The Physical Science Basis. Contribution of Working Group I to the Sixth Assessment Report of the Intergovernmental Panel on Climate Change,” in Climate Change, vol. 2021 . Eds. Masson-Delmotte V., Zhai P., Pirani A., Connors S. L., Péan C., Berger S., et al (Cambridge University Press). doi: 10.1017/9781009157896
Johansson G., Snoeijs P. (2002). Macroalgal Photosynthetic Responses to Light in Relation to Thallus Morphology and Depth Zonation. Mar. Ecol. Prog. Ser. 244, 63–72. doi: 10.3354/meps244063
Jones C. D., Ciais P., Davis S. J., Friedlingstein P., Gasser T., Peters G. P., et al. (2016). Simulating the Earth System Response to Negative Emissions. Environ. Res. Lett. 11. doi: 10.1088/1748-9326/11/9/095012
Karl D. M., Letelier R. M. (2008). Nitrogen Fixation-Enhanced Carbon Sequestration in Low Nitrate, Low Chlorophyll Seascapes. Mar. Ecol. Prog. Ser. 364, 257–268. doi: 10.3354/meps07547
Keller D. P., Feng E. Y., Oschlies A. (2014). Potential Climate Engineering Effectiveness and Side Effects During a High Carbon Dioxide-Emission Scenario. Nat. Commun. 5, 3304. doi: 10.1038/ncomms4304
Keller D. P., Lenton A., Littleton E. W., Oschlies A., Scott V., Vaughan N. E. (2018). The Effects of Carbon Dioxide Removal on the Carbon Cycle. Curr. Climate Change Rep. 4, 250–265. doi: 10.1007/s40641-018-0104-3
Kirke B. (2003). Enhancing Fish Stocks With Wave-Powered Artificial Upwelling. Ocean. Coast. Manage. 46, 901–915. doi: 10.1016/S0964-5691(03)00067-X
Kithil P. W. (2007). “Self-Reported Results of Field Trial,” in Ocean-Based Climate Solutions. Available at: https://ocean-based.com/science.
Kwiatkowski L., Ricke K. L., Caldeira K. (2015). Atmospheric Consequences of Disruption of the Ocean Thermocline. Environ. Res. Lett. 10, 34016. doi: 10.1088/1748-9326/10/3/034016
Lauvset S. K., Key R. M., Olsen A., Van Heuven S., Velo A., Lin X., et al. (2016). A New Global Interior Ocean Mapped Climatology: The 1° × 1° GLODAP Version 2. Earth Sys. Sci. Data 8, 325–340. doi: 10.5194/essd-8-325-2016
Letelier R. M., Strutton P. G., Karl D. M. (2008). Physical and Ecological Uncertainties in the Widespread Implementation of Controlled Upwelling in the North Pacific Subtropical Gyre. Mar. Ecol. Prog. Ser. 371, 305–308. doi: 10.3354/meps07773
Liu C. C. K., Jin Q. (1995). Artificial Upwelling in Regular Waves. Ocean. Eng. 22, 337–350. doi: 10.1016/0029-8018(94)00019-4
Moore J. K., Braucher O. (2008). Sedimentary and Mineral Dust Sources of Dissolved Iron to the World Ocean. Biogeosciences 5, 631–656. doi: 10.5194/bg-5-631-2008
Moore C. M., Mills M. M., Arrigo K. R., Berman-Frank I., Bopp L., Boyd P. W., et al. (2013). Processes and Patterns of Oceanic Nutrient Limitation. Nat. Geosci. 6, 701–710. doi: 10.1038/ngeo1765
Moreira D., Pires J. C. M. (2016). Atmospheric CO2 Capture by Algae: Negative Carbon Dioxide Emission Path. Biores. Technol. 215, 371–379. doi: 10.1016/j.biortech.2016.03.060
NASA (2020). Moderate-Resolution Imaging Spectroradiometer (MODIS) Aqua Photosynthetically Available Radiation Data; 2018 Reprocessing. NASA OB.DAAC. Greenbelt, MD, United States. doi: 10.5067/AQUA/MODIS/L3B/PAR/2018
National Academies of Sciences, Engineering, and Medicine (2019). Negative Emissions Technologies and Reliable Sequestration: A Research Agenda (Washington DC: National Academies Press). doi: 10.17226/25259
National Academies of Sciences, Engineering, Medicine (2022). A Research Strategy for Ocean-Based Carbon Dioxide Removal and Sequestration. (Washington, DC: The National Academies Press). doi: 10.17226/26278
OceanNETs (2021) European Union Horizon 2020 Research; Innovation Programme. Available at: https://www.oceannets.eu/.
Oschlies A., Pahlow M., Yool A., Matear R. J. (2010). Climate Engineering by Artificial Ocean Upwelling: Channelling the Sorcerer’s Apprentice. Geophys. Res. Lett. 37, 1–5. doi: 10.1029/2009GL041961
Pan Y., Fan W., Zhang D., Chen J., Huang H., Liu S., et al. (2016). Research Progress in Artificial Upwelling and its Potential Environmental Effects. Sci. China Earth Sci. 59, 236–248. doi: 10.1007/s11430-015-5195-2
Pan Y., Li Y., Fan W. E. I., Zhang D., Qiang Y., Jiang Z. P., et al. (2019). A Sea Trial of Air-Lift Concept Artificial Upwelling in the East China Sea. J. Atmosph. Ocean. Technol. 36, 2191–2204. doi: 10.1175/JTECH-D-18-0238.1
Redfield A. C. (1934). “On the Proportions of Organic Derivatives in Sea Water and Their Relation to the Composition of Plankton,” in James Johnston Memorial Volume. Ed. Daniel R. J. (Liverpool, England: University Press Liverpool), 176–192.
Roberts D. A., Paul N. A., Dworjanyn S. A., Bird M. I., De Nys R. (2015). Biochar From Commercially Cultivated Seaweed for Soil Amelioration. Sci. Rep. 5, 1–6. doi: 10.1038/srep09665
Sarmiento J. L., Gruber N. (2006). Ocean Biogeochemical Dynamics (Princeton, New Jersey: Princeton University Press).
Siegel D. A., DeVries T., Doney S. C., Bell T. (2021). Assessing the Sequestration Time Scales of Some Ocean-Based Carbon Dioxide Reduction Strategies. Environ. Res. Lett. 16, 104003. doi: 10.1088/1748-9326/ac0be0
Stommel H., Arons A. B., Blanchard D. (1956). An Oceanographical Curiosity: The Perpetual Salt Fountain. Deep. Sea. Res. (1953). 3, 152–153. doi: 10.1016/0146-6313(56)90095-8
Taucher J., Boxhammer T., Bach L. T., Paul A. J., Schartau M., Stange P., et al. (2021). Changing Carbon-to-Nitrogen Ratios of Organic-Matter Export Under Ocean Acidification. Nat. Climate Change 11, 52–57. doi: 10.1038/s41558-020-00915-5
Vershinskiy N. V., Pshenichnyy B. P., Soloviev A. V. (1987). Artificial Upwelling Using the Energy of Surface Waves. Oceanology 27, 400–402.
Ocean Visions (2021) Ocean-Based Carbon Dioxide Removal: Road Maps. Available at: https://oceanvisions.org/roadmaps/.
Wanninkhof R., Asher W. E., Ho D. T., Sweeney C., McGillis W. R. (2009). Advances in Quantifying Air-Sea Gas Exchange and Environmental Forcing. Annu. Rev. Mar. Sci. 1, 213–244. doi: 10.1146/annurev.marine.010908.163742
Weiss R. (1974). Carbon Dioxide in Water and Seawater: The Solubility of a Non-Ideal Gas. Mar. Chem. 2, 203–215. doi: 10.1016/0304-4203(74)90015-2
White A., Björkman K., Grabowski E., Letelier R., Poulos S., Watkins B., et al. (2010). An Open Ocean Trial of Controlled Upwelling Using Wave Pump Technology. J. Atmosph. Ocean. Technol. 27, 385–396. doi: 10.1175/2009JTECHO679.1
Keywords: ocean-based carbon dioxide removal (CDR), ocean-based NETs, Artificial upwelling, Negative Emission Technologies (NETs), Carbon Dioxide Removal (CDR)
Citation: Koweek DA (2022) Expected Limits on the Potential for Carbon Dioxide Removal From Artificial Upwelling. Front. Mar. Sci. 9:841894. doi: 10.3389/fmars.2022.841894
Received: 22 December 2021; Accepted: 13 May 2022;
Published: 29 June 2022.
Edited by:
Javier Arístegui, University of Las Palmas de Gran Canaria, SpainReviewed by:
Matthew Paul Humphreys, Royal Netherlands Institute for Sea Research (NIOZ), NetherlandsKatja Fennel, Dalhousie University, Canada
Copyright © 2022 Koweek. This is an open-access article distributed under the terms of the Creative Commons Attribution License (CC BY). The use, distribution or reproduction in other forums is permitted, provided the original author(s) and the copyright owner(s) are credited and that the original publication in this journal is cited, in accordance with accepted academic practice. No use, distribution or reproduction is permitted which does not comply with these terms.
*Correspondence: David A. Koweek, david.koweek@oceanvisions.org