Reports
Sale

Global Nitric Acid Market Size, Share, Trends, Forecast: By Concentration: Dilute Nitric Acid (68%), Concentrated Nitric Acid (69%-71%); By Application: Fertilizers, Adipic Acid, Nitrobenzene, Toluene Di-Isocyanate (TDI), Nitrochlorobenzene, Ammonium Nitrate, Others; By End Use; Regional Analysis; Competitive Landscape; 2024-2032
Global Nitric Acid Market Outlook
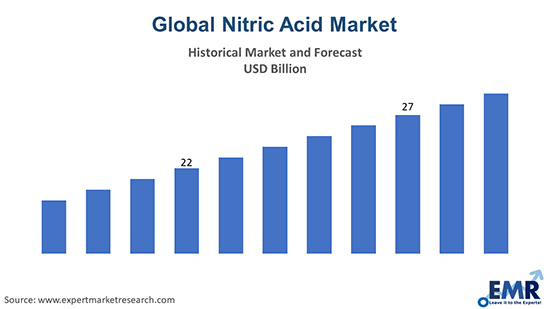
The global nitric acid market reached a value of about USD 26.99 billion in 2023. The industry is further expected to grow at a CAGR of about 3.0% in the forecast period of 2024-2032 to reach a value of around USD 35.23 billion by 2032.
Read more about this report - REQUEST FREE SAMPLE COPY IN PDF
North America to be one of the Leading Regions for the Global Market
The North America region is expected to see substantial growth in the forecast period due to the presence of a significant number of multinational chemical manufacturers in the United States. The nitric acid market is likely to further represent high growth due to the rapid development of industries including construction, automotive, agriculture and furniture. These industries demand high-quality nitric acid for the production of fertilizers and nylon. In addition, there has been a growing demand for ammonium nitrate from the mining industry to develop explosives, which, in turn, is driving overall market development. There was slight decline in the market growth due to the COVID-19 restrictions on industries, however, the demand started rising towards the end of 2020 and is likely to witness healthy growth in the coming years.
Asia Pacific to Witness Robust Growth in the Coming Years
Asia-Pacific is expected to be among the leading region in the manufacture of nitric acid. This is because China is the largest manufacturer and user of fertilizers. In countries like China and India, the market for nitric acid has steadily increased. Asia-Pacific is projected to witness the fastest growth in the coming years, with rising demand from end-users such as fertilizers, inks, and the chemical processing industries.
Nitric Acid: Market Segmentation
Nitric acid, also referred to as aqua fortis and spirit of niter, is a highly corrosive mineral acid. The pure compound is colourless, however older samples appear to be cast yellow due to decay into nitrogen oxides and water. On being combined with hydrochloric acid, an element known as aqua regia is formed.
Read more about this report - REQUEST FREE SAMPLE COPY IN PDF
Based on concentration, the industry can be divided into:
- Dilute Nitric Acid (68%)
- Concentrated Nitric Acid (69%-71%)
The product finds wide applications in the following:
- Fertilizers
- Adipic Acid
- Nitrobenzene
- Toluene Di-Isocyanate (TDI)
- Nitrochlorobenzene
- Ammonium Nitrate
- Others
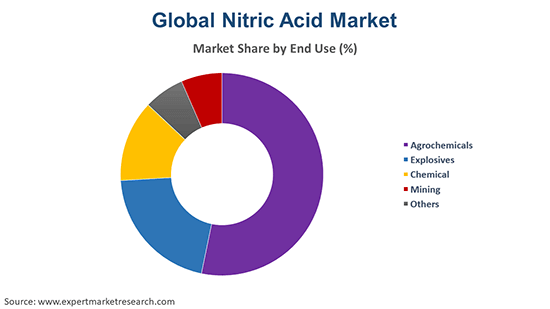
The end-uses of the product can be segmented as follows:
- Agrochemicals
- Explosives
- Chemical
- Mining
- Others
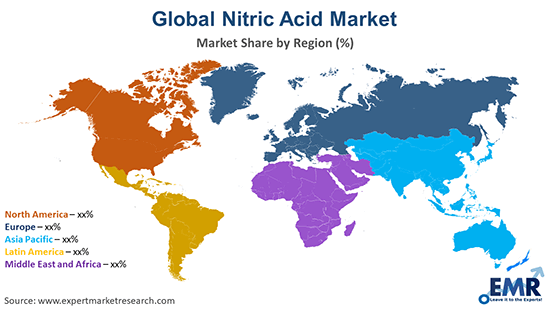
The regional markets for nitric acid can be divided into North America, Europe, the Asia Pacific, Latin America, and the Middle East and Africa.
Read more about this report - REQUEST FREE SAMPLE COPY IN PDF
Rising Demand for Fertilisers the Market Growth
The growth of the nitric acid market can be attributed to the rising demand of the product in the end-use industries. The rising use of nitric acid in the manufacturing of various agrochemicals including ammonium nitrate (AN), urea ammonium nitrate, and calcium ammonium nitrate is likely to boost its demand in the market. The demand for fertilizers due to high demand for high crop yields to reflect the increasing need for crops is expected to be a crucial driver of nitric acid market during the forecast era. Its derivative, ammonium nitrate, is mainly used in explosives, and increased demand for explosives in the military and defence industries is expected to increase the growth of the global nitric acid industry. Other factors boosting the market growth include the rising disposable incomes of the consumers and the rising adoption of modern agricultural techniques.
Key Industry Players in the Global Nitric Acid Market
The report gives a detailed analysis of the following key players in the global nitric acid market, covering their competitive landscape, capacity, and latest developments like mergers, acquisitions, and investments, expansions of capacity, and plant turnarounds:
- BASF SE
- Columbus Chemicals
- Deepak Fertilisers and Petrochemicals Corporation Ltd
- Mitsubishi Chemical Corporation
- Nutrien Ltd.
- Others
The comprehensive EMR report provides an in-depth assessment of the market based on the Porter's five forces model along with giving a SWOT analysis.
Key Highlights of the Report
| REPORT FEATURES | DETAILS |
| Base Year | 2023 |
| Historical Period | 2018-2023 |
| Forecast Period | 2024-2032 |
| Scope of the Report |
Historical and Forecast Trends, Industry Drivers and Constraints, Historical and Forecast Market Analysis by Segment:
|
| Breakup by Concentration |
|
| Breakup by Application |
|
| Breakup by End Use |
|
| Breakup by Region |
|
| Market Dynamics |
|
| Competitive Landscape |
|
| Companies Covered |
|
| Report Price and Purchase Option | Explore our purchase options that are best suited to your resources and industry needs. |
| Delivery Format | Delivered as an attached PDF and Excel through email, with an option of receiving an editable PPT, according to the purchase option. |
*At Expert Market Research, we strive to always give you current and accurate information. The numbers depicted in the description are indicative and may differ from the actual numbers in the final EMR report.
1 Preface
2 Report Coverage – Key Segmentation and Scope
3 Report Description
3.1 Market Definition and Outlook
3.2 Properties and Applications
3.3 Market Analysis
3.4 Key Players
4 Key Assumptions
5 Executive Summary
5.1 Overview
5.2 Key Drivers
5.3 Key Developments
5.4 Competitive Structure
5.5 Key Industrial Trends
6 Snapshot
6.1 Global
6.2 Regional
7 Opportunities and Challenges in the Market
8 Global Nitric Acid Market Analysis
8.1 Key Industry Highlights
8.2 Global Nitric Acid Historical Market (2018-2023)
8.3 Global Nitric Acid Market Forecast (2024-2032)
8.4 Global Nitric Acid Market by Concentration
8.4.1 Dilute Nitric Acid (68%)
8.4.1.1 Historical Trend (2018-2023)
8.4.1.2 Forecast Trend (2024-2032)
8.4.2 Concentrated Nitric Acid (69%-71%)
8.4.2.1 Historical Trend (2018-2023)
8.4.2.2 Forecast Trend (2024-2032)
8.5 Global Nitric Acid Market by Application
8.5.1 Fertilizers
8.5.1.1 Historical Trend (2018-2023)
8.5.1.2 Forecast Trend (2024-2032)
8.5.2 Adipic Acid
8.5.2.1 Historical Trend (2018-2023)
8.5.2.2 Forecast Trend (2024-2032)
8.5.3 Nitrobenzene
8.5.3.1 Historical Trend (2018-2023)
8.5.3.2 Forecast Trend (2024-2032)
8.5.4 Toluene Di-Isocyanate (TDI)
8.5.4.1 Historical Trend (2018-2023)
8.5.4.2 Forecast Trend (2024-2032)
8.5.5 Nitrochlorobenzene
8.5.5.1 Historical Trend (2018-2023)
8.5.5.2 Forecast Trend (2024-2032)
8.5.6 Ammonium Nitrate
8.5.6.1 Historical Trend (2018-2023)
8.5.6.2 Forecast Trend (2024-2032)
8.5.7 Others
8.6 Global Nitric Acid Market by End Use
8.6.1 Agrochemicals
8.6.1.1 Historical Trend (2018-2023)
8.6.1.2 Forecast Trend (2024-2032)
8.6.2 Explosives
8.6.2.1 Historical Trend (2018-2023)
8.6.2.2 Forecast Trend (2024-2032)
8.6.3 Chemical
8.6.3.1 Historical Trend (2018-2023)
8.6.3.2 Forecast Trend (2024-2032)
8.6.4 Mining
8.6.4.1 Historical Trend (2018-2023)
8.6.4.2 Forecast Trend (2024-2032)
8.6.5 Others
8.7 Global Nitric Acid Market by Region
8.7.1 North America
8.7.1.1 Historical Trend (2018-2023)
8.7.1.2 Forecast Trend (2024-2032)
8.7.2 Europe
8.7.2.1 Historical Trend (2018-2023)
8.7.2.2 Forecast Trend (2024-2032)
8.7.3 Asia Pacific
8.7.3.1 Historical Trend (2018-2023)
8.7.3.2 Forecast Trend (2024-2032)
8.7.4 Latin America
8.7.4.1 Historical Trend (2018-2023)
8.7.4.2 Forecast Trend (2024-2032)
8.7.5 Middle East and Africa
8.7.5.1 Historical Trend (2018-2023)
8.7.5.2 Forecast Trend (2024-2032)
9 North America Nitric Acid Market Analysis
9.1 United States of America
9.1.1 Historical Trend (2018-2023)
9.1.2 Forecast Trend (2024-2032)
9.2 Canada
9.2.1 Historical Trend (2018-2023)
9.2.2 Forecast Trend (2024-2032)
10 Europe Nitric Acid Market Analysis
10.1 United Kingdom
10.1.1 Historical Trend (2018-2023)
10.1.2 Forecast Trend (2024-2032)
10.2 Germany
10.2.1 Historical Trend (2018-2023)
10.2.2 Forecast Trend (2024-2032)
10.3 France
10.3.1 Historical Trend (2018-2023)
10.3.2 Forecast Trend (2024-2032)
10.4 Italy
10.4.1 Historical Trend (2018-2023)
10.4.2 Forecast Trend (2024-2032)
10.5 Others
11 Asia Pacific Nitric Acid Market Analysis
11.1 China
11.1.1 Historical Trend (2018-2023)
11.1.2 Forecast Trend (2024-2032)
11.2 Japan
11.2.1 Historical Trend (2018-2023)
11.2.2 Forecast Trend (2024-2032)
11.3 India
11.3.1 Historical Trend (2018-2023)
11.3.2 Forecast Trend (2024-2032)
11.4 ASEAN
11.4.1 Historical Trend (2018-2023)
11.4.2 Forecast Trend (2024-2032)
11.5 Australia
11.5.1 Historical Trend (2018-2023)
11.5.2 Forecast Trend (2024-2032)
11.6 Others
12 Latin America Nitric Acid Market Analysis
12.1 Brazil
12.1.1 Historical Trend (2018-2023)
12.1.2 Forecast Trend (2024-2032)
12.2 Argentina
12.2.1 Historical Trend (2018-2023)
12.2.2 Forecast Trend (2024-2032)
12.3 Mexico
12.3.1 Historical Trend (2018-2023)
12.3.2 Forecast Trend (2024-2032)
12.4 Others
13 Middle East and Africa Nitric Acid Market Analysis
13.1 Saudi Arabia
13.1.1 Historical Trend (2018-2023)
13.1.2 Forecast Trend (2024-2032)
13.2 United Arab Emirates
13.2.1 Historical Trend (2018-2023)
13.2.2 Forecast Trend (2024-2032)
13.3 Nigeria
13.3.1 Historical Trend (2018-2023)
13.3.2 Forecast Trend (2024-2032)
13.4 South Africa
13.4.1 Historical Trend (2018-2023)
13.4.2 Forecast Trend (2024-2032)
13.5 Others
14 Market Dynamics
14.1 SWOT Analysis
14.1.1 Strengths
14.1.2 Weaknesses
14.1.3 Opportunities
14.1.4 Threats
14.2 Porter’s Five Forces Analysis
14.2.1 Supplier’s Power
14.2.2 Buyer’s Power
14.2.3 Threat of New Entrants
14.2.4 Degree of Rivalry
14.2.5 Threat of Substitutes
14.3 Key Indicators for Demand
14.4 Key Indicators for Price
15 Value Chain Analysis
16 Trade Data Analysis (HS Code: 2808)
16.1 Major Importing Countries
16.1.1 By Volume
16.1.2 By Value
16.2 Major Exporting Countries
16.2.1 By Volume
16.2.2 By Value
17 Price Analysis
17.1 North America Historical Price Trends (2018-2023) and Forecast (2024-2032)
17.2 Europe Historical Price Trends (2018-2023) and Forecast (2024-2032)
17.3 Asia Pacific Historical Price Trends (2018-2023) and Forecast (2024-2032)
17.4 Latin America Historical Price Trends (2018-2023) and Forecast (2024-2032)
17.5 Middle East and Africa Historical Price Trends (2018-2023) and Forecast (2024-2032)
18 Competitive Landscape
18.1 Market Structure
18.2 Company Profiles
18.2.1 BASF SE
18.2.1.1 Company Overview
18.2.1.2 Product Portfolio
18.2.1.3 Demographic Reach and Achievements
18.2.1.4 Certifications
18.2.2 Columbus Chemicals
18.2.2.1 Company Overview
18.2.2.2 Product Portfolio
18.2.2.3 Demographic Reach and Achievements
18.2.2.4 Certifications
18.2.3 Deepak Fertilisers and Petrochemicals Corporation Ltd
18.2.3.1 Company Overview
18.2.3.2 Product Portfolio
18.2.3.3 Demographic Reach and Achievements
18.2.3.4 Certifications
18.2.4 Mitsubishi Chemical Corporation
18.2.4.1 Company Overview
18.2.4.2 Product Portfolio
18.2.4.3 Demographic Reach and Achievements
18.2.4.4 Certifications
18.2.5 Nutrien Ltd.
18.2.5.1 Company Overview
18.2.5.2 Product Portfolio
18.2.5.3 Demographic Reach and Achievements
18.2.5.4 Certifications
18.2.6 Others
19 Key Trends and Developments in the Market
Additional Customisations Available
1 Manufacturing Process
1.1 Overview
1.2 Detailed Process Flow
1.3 Operation Involved
2 Project Requirement and Cost Analysis
2.1 Land, Location and Site Development
2.2 Construction
2.3 Plant Machinery
2.4 Cost of Raw Material
2.5 Packaging
2.6 Transportation
2.7 Utilities
2.8 Manpower
2.9 Other Capital Investment
List of Key Figures and Tables
1. Global Nitric Acid Market: Key Industry Highlights, 2018 and 2032
2. Global Nitric Acid Historical Market: Breakup by Concentration (USD Million), 2018-2023
3. Global Nitric Acid Market Forecast: Breakup by Concentration (USD Million), 2024-2032
4. Global Nitric Acid Historical Market: Breakup by Application (USD Million), 2018-2023
5. Global Nitric Acid Market Forecast: Breakup by Application (USD Million), 2024-2032
6. Global Nitric Acid Historical Market: Breakup by End Use (USD Million), 2018-2023
7. Global Nitric Acid Market Forecast: Breakup by End Use (USD Million), 2024-2032
8. Global Nitric Acid Historical Market: Breakup by Region (USD Million), 2018-2023
9. Global Nitric Acid Market Forecast: Breakup by Region (USD Million), 2024-2032
10. North America Nitric Acid Historical Market: Breakup by Country (USD Million), 2018-2023
11. North America Nitric Acid Market Forecast: Breakup by Country (USD Million), 2024-2032
12. Europe Nitric Acid Historical Market: Breakup by Country (USD Million), 2018-2023
13. Europe Nitric Acid Market Forecast: Breakup by Country (USD Million), 2024-2032
14. Asia Pacific Nitric Acid Historical Market: Breakup by Country (USD Million), 2018-2023
15. Asia Pacific Nitric Acid Market Forecast: Breakup by Country (USD Million), 2024-2032
16. Latin America Nitric Acid Historical Market: Breakup by Country (USD Million), 2018-2023
17. Latin America Nitric Acid Market Forecast: Breakup by Country (USD Million), 2024-2032
18. Middle East and Africa Nitric Acid Historical Market: Breakup by Country (USD Million), 2018-2023
19. Middle East and Africa Nitric Acid Market Forecast: Breakup by Country (USD Million), 2024-2032
20. Major Importing Countries by Volume
21. Major Exporting Countries by Volume
22. Major Importing Countries by Value
23. Major Exporting Countries by Value
24. North America Historical Price Trends and Forecast 2018-2028
25. Europe Historical Price Trends and Forecast 2018-2028
26. Asia Pacific Historical Price Trends and Forecast 2018-2028
27. Latin America Historical Price Trends and Forecast 2018-2028
28. Middle East and Africa Historical Price Trends and Forecast 2018-2028
29. Global Nitric Acid Market Structure
Key Questions Answered in the Report
In 2023, the global nitric acid market attained a value of nearly USD 26.99 billion.
The market is projected to grow at a CAGR of 3% between 2024 and 2032.
The market is estimated to witness a healthy growth in the forecast period of 2024-2032 to reach USD 35.23 billion by 2032.
The rising population levels and the rising use of nitric acid in the manufacturing of various agrochemicals, including ammonium nitrate (AN), urea ammonium nitrate, and calcium ammonium nitrate, among others, are the major market drivers.
The key trends guiding the market growth are the rising use of fertilisers and agrochemicals in the agricultural sector and the increasing demand of explosives in the military and defence sectors.
The major regions in the market are North America, Latin America, the Middle East and Africa, Europe, and the Asia Pacific.
The major segments based on concentration of nitric acid considered in the market report are dilute nitric acid (68%) and concentrated nitric acid (69%-71%).
The various applications of nitric acid are fertilisers, adipic acid, nitrobenzene, toluene di-isocyanate (TDI), nitrochlorobenzene, and ammonium nitrate, among others.
The significant end uses of nitric acid include agrochemicals, explosives, chemical, and mining, among others.
The key players in the market are BASF SE, Columbus Chemicals, Deepak Fertilisers and Petrochemicals Corporation Ltd, Mitsubishi Chemical Corporation, and Nutrien Ltd., among others.
Analyst Review
The global nitric acid market attained a value of USD 26.99 billion in 2023, driven by the rising use of nitric acid in the manufacturing of various agrochemicals including ammonium nitrate (AN), urea ammonium nitrate, and calcium ammonium nitrate. Aided by the demand for fertilisers due to high demand for high crop yields and the increased demand for explosives in the military, the market is expected to witness a further growth in the forecast period of 2024-2032, growing at a CAGR of 3%. The market is projected to reach USD 35.23 billion by 2032.
EMR’s meticulous research methodology delves deep into the market, covering the macro and micro aspects of the industry. In terms of concentration, the significant types are dilute nitric acid (68%) and concentrated nitric acid (69%-71%). The leading application segments of nitric acid are fertilisers, adipic acid, nitrobenzene, toluene di-isocyanate (tdi), nitrochlorobenzene and ammonium nitrate, among others. The end-use can be divided into agrochemicals, explosives, chemical, and mining, among others. The major regional markets for nitric acid are North America, Europe, the Asia Pacific, Latin America, and the Middle East and Africa. The key players in the above market include BASF SE, Columbus Chemicals, Deepak Fertilisers and Petrochemicals Corporation Ltd, Mitsubishi Chemical Corporation and Nutrien Ltd., among others.
EMR’s research methodology uses a combination of cutting-edge analytical tools and the expertise of their highly accomplished team, thus, providing their customers with market insights that are accurate, actionable, and help them remain ahead of their competition.
Purchase Options 10% off


Call us
Purchase Full Report
Mini Report
$ 2199
$1999
-
Selected Sections, One User
-
Printing Not Allowed
-
Email Delivery in PDF
-
Free Limited Customisation -
Post Sales Analyst Support -
50% Discount on Next Update
Single User License
$ 3299
$2999
-
All Sections, One User
-
One Print Allowed
-
Email Delivery in PDF
-
Free Limited Customisation -
Post Sales Analyst Support -
50% Discount on Next Update

Five User License
$ 4399
$3999
-
All Sections, Five Users
-
Five Prints Allowed
-
Email Delivery in PDF
-
Free Limited Customisation
-
Post Sales Analyst Support
-
50% Discount on Next Update
Corporate License
$ 5499
$4999
-
All Sections, Unlimited Users
-
Unlimited Prints Allowed
-
Email Delivery in PDF + Excel
-
Free Limited Customisation
-
Post Sales Analyst Support
-
50% Discount on Next Update
Any Question? Speak With An Analyst
View A Sample
Did You Miss Anything, Ask Now
Why Expert Market Research?
Right People
We are technically excellent, strategic, practical, experienced and efficient; our analysts are hand-picked based on having the right attributes to work successfully and execute projects based on your expectations.
Right Methodology
We leverage our cutting-edge technology, our access to trusted databases, and our knowledge of the current models used in the market to deliver you research solutions that are tailored to your needs and put you ahead of the curve.
Right Price
We deliver in-depth and superior quality research in prices that are reasonable, unmatchable, and shows our understanding of your resource structure. We, additionally, offer attractive discounts on our upcoming reports.
Right Support
Our team of expert analysts are at your beck and call to deliver you optimum results that are customised to meet your precise needs within the specified timeframe and help you form a better understanding of the industry.
NEWSLETTER